

0 Introduction
Everything came together today for this particular piece. I wanted to familiarize myself with Python’s matplotlib and at the same time explore the relationship of the Residential Real Estate Price Index (RREPI) to the three economic factors; Money Supply, Price Inflation and Interest Rate.
Along the way, I’d like to answer the questions: what is the best property to buy and when is the right time to buy and sell?
Note: Data scientists, economists, bankers and statisticians might roll their eyes if and when they read how elementary this topic is but we will nevertheless pursue it. We will provide utmost importance in supplying the sources of the data that we used in order for anyone interested to scrutinize or verify.
Sample Size
This early in the article, I’d like to point out that our main deficiency is the small sample size. The Residential Real Estate Price Index (RREPI) started in 2016, so at max, we only have five years of data to use.
Caution on Statistics (You can skip this part and go directly to the Residential Real Estate Price Index)
Since I will be basing the content of this piece heavily on statistics provided by government agencies, I would like to add a cautionary note.
In professor David J. Hand’s book STATISTICS – A very Short Introduction, there was an amusing line on page 5:
“lies, dammed lies and statistics”.
On page 6, Professor Hand shares a quote from Arthur Hailey’s novel Airport:
“legal proceedings are like statistics. If you manipulate them, you can prove anything”. Emphasis mine.
We have to trust the numbers provided by our Central Bankers and Government Statisticians but also have be wary that they may not be perfect and/or may contain biases.
1 Residential Real Estate Price Index (RREPI)
We will start with Bangko Sentral ng Pilipinas’ Residential Real Estate Price Index or RREPI.
RREPI’s chief function is to measure the changes in residential property prices through the Residential Real Estate Loans granted by banks. This was created in 2016 and is one of the best tools to appreciate previous price trends and maybe, even predict future ones. Thanks to the foresight of former BSP governor Amando M. Tetangco, Jr., we have something to work on.
I’d like to stress that it is the only government-issued, publicly available data that could easily show us the growth in the financial value of residential properties beginning in 2016. The Bureau of Internal Revenue, Land Registration Authority, Department of Human Settlements and Urban Development (formerly HLURB), private developers and individual real estate real estate brokerages don’t publish real estate transaction data. Others consider it a strength; transaction data is a trade secret. I consider it as one of the weaknesses of my industry.
In theory, we could try to examine all the Financial Statements of publicly traded real estate developers and check their real estate revenues over the past couple of years and extrapolate the growth of sales and increase in prices from there, but that would be extremely tedious work and I will not do that. At least, not for now.
Definitions
The BSP defines RREPI as,
“an indicator of change in the prices of residential properties in the Philippines over a period of time. The growth rate of the index measures the house price inflation.”
You may read the technical notes here.
You may think of it like this: banks like BDO, BPI, UCPB, Metrobank submit a quarterly report to the BSP containing the number of residential loans that they gave out to people, like you and I, together with other details like the amount of loan, type of property, location, etc.
From there, the Central Bankers uses this formula to compute the index:
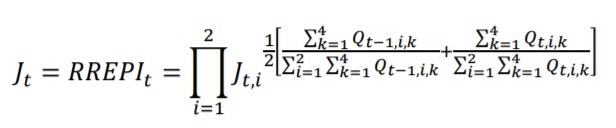
where Jt,i = RREPI of the ith area at quarter t;
Q = total floor area of the kth type of housing unit in the ith area at quarter t.
∏ = index of multiplication
“The RREPI by area are aggregated multiplicatively and weighted by the arithmetic averages of quantity shares of all types of housing unit in the ith area to grand totals for both areas in the previous and current periods.”
The Table
The RREPI is a big table full of numbers as shown below; At the top, you’ll see years and quarters, from 2016 until the most recent quarter reported. On the left side you’ll find the descriptions and on the body you’ll find a wall of decimal numbers.
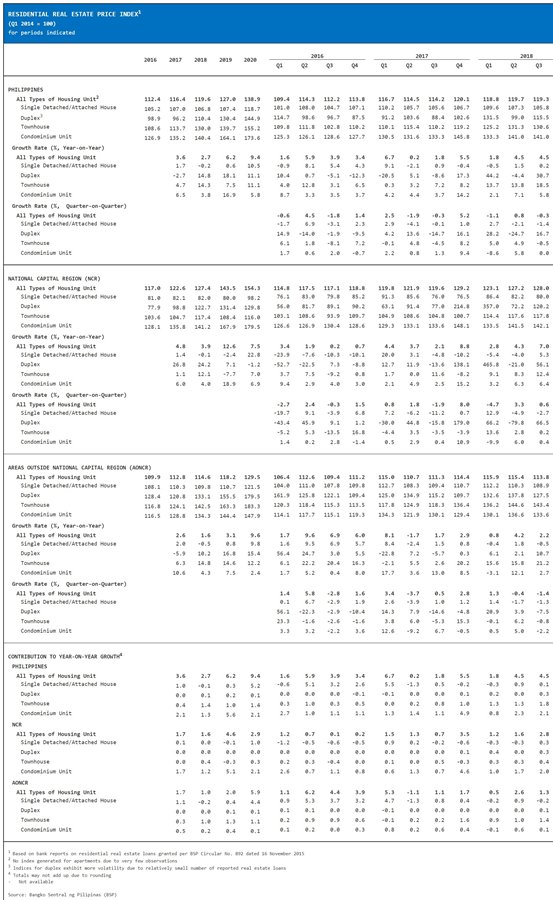
It provides us with the opportunity to see quarterly and annual changes and isolate the types of properties and their general location. For this exercise, we will simply focus on the annual summary, then move down to the 4 types of properties in the NCR group.
All Types of Housing. Annual
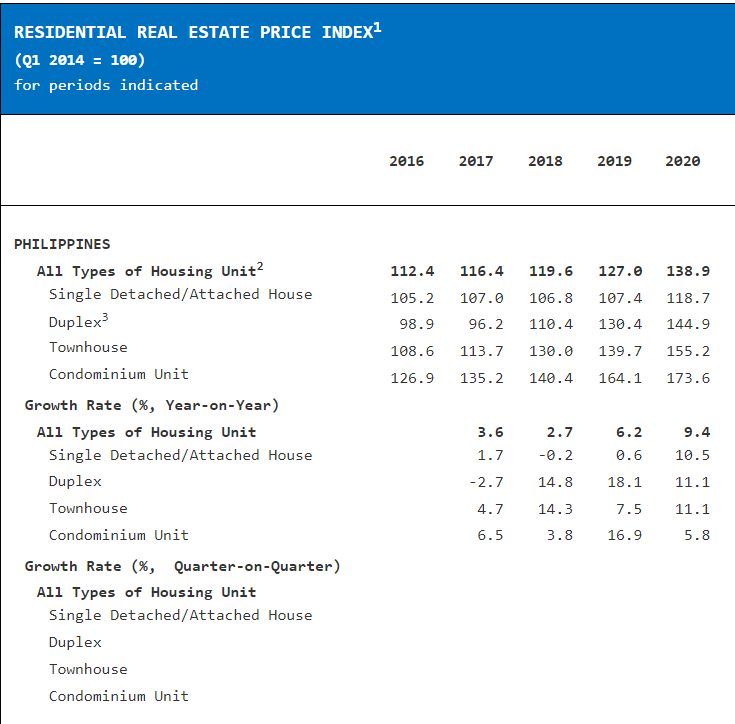
Let’s take a look at the overall real estate market from 2016 up to 2020.
Price increase for “All Types of Housing Unit” around the country:
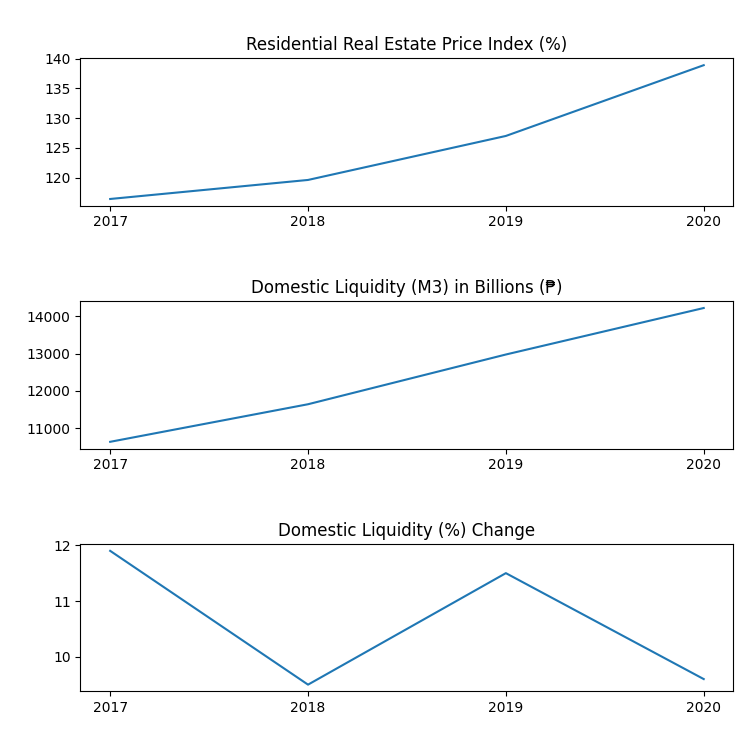
2016 = 112.4, 2017 = 116.4, 2018 = 119.6, 2019 = 127.0, 2020 = 138.9
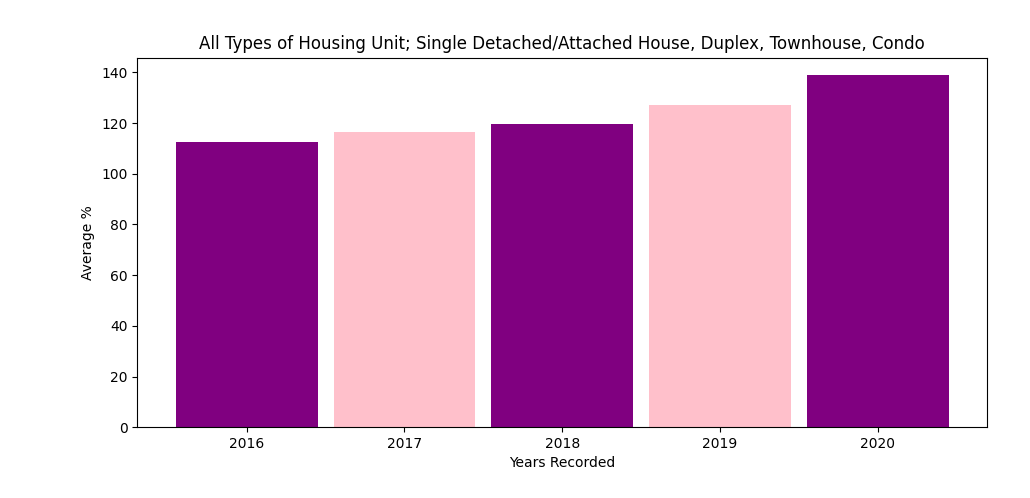 The chart shows us the steady rise of prices in the entire archipelago over the course of 5 years.
All Types of Housing. Growth Rate. Year-on-Year
Now, we take a look at the growth rate for each of those years.
Growth rate: 2017 = 3.6%, 2018 = 2.7%, 2019 = 6.2%, 2020 = 9.4%
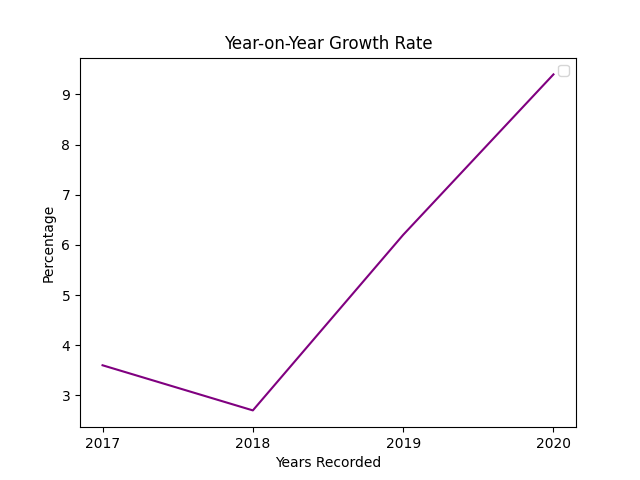
The chart reveals what looks like a hockey stick growth; the market suffered a decline in 2018, but recovered up until last year.
Different Types of Housing. NCR. Annual
Type | 2016 | 2017 | 2018 | 2019 | 2020 |
Single Detached/Attached House | 81 | 82.1 | 82 | 80 | 98.2 |
Duplex | 77.9 | 98.8 | 122.7 | 131.4 | 129.8 |
Townhouse | 103.6 | 104.7 | 117.4 | 108.4 | 116 |
Condominium Unit | 128.1 | 135.8 | 141.2 | 167.9 | 179.5 |
Plotting the above numbers would show us this…
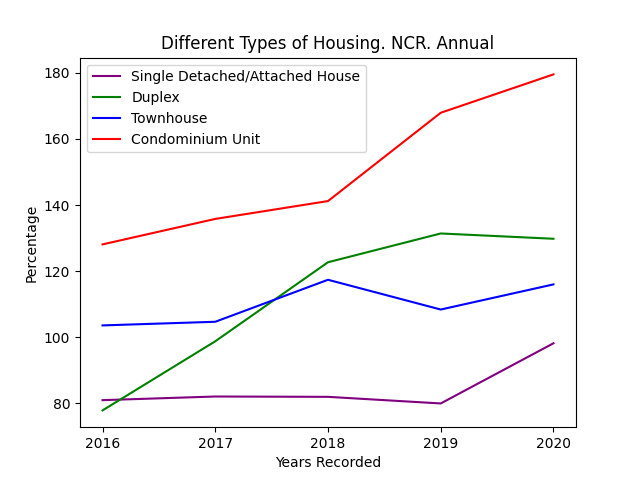
The general summary show that all types of properties in the Philippines increased in value. But, by looking at a more granular level, like analyzing the individual growth of each property type, we can have a better insight into the situation; If you bought a Single Detached/Attached House (purple line) in 2016 and sold in 2019, you may not have made enough money in that transaction. But if you bought a Condo (red line) you may have came out as a winner.
Growth Rate (%, Year-on-Year). Different Types of Housing. NCR. Annual
Type | 2017 | 2018 | 2019 | 2020 |
Single Detached/Attached House | 1.4 | -0.1 | -2.4 | 22.8 |
Duplex | 26.8 | 24.2 | 7.1 | -1.2 |
Townhouse | 1.1 | 12.1 | -7.7 | 7.0 |
Condominium Unit | 6.0 | 4.0 | 18.9 | 6.9 |
And the plot looks funky…
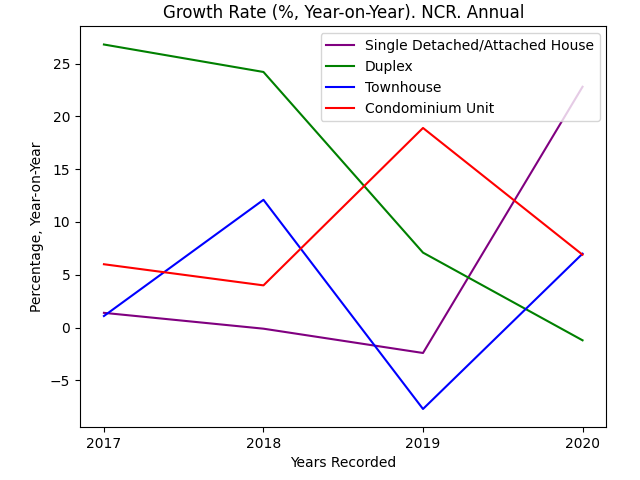 The growth rate of the value on each type of property is pretty interesting. The price and growth rate of Single Detached/Attached Houses (purple line) started to rise in 2019, Duplex (green line) rapidly declined, Townhouses (blue line) made extreme swings and although Condo (red line) prices have increased, its growth rate has dropped to almost the same level as 2017.
Unfortunately, at this point, we could only speculate on the causes behind the movements. For one, there is a possibility that Single Detached/Attached Houses and Townhouses in NCR had an incredible increase in their growth starting 2019 partly due to the COVID19 pandemic; more families chose to reside on houses and townhouses to minimize close contact with other people. Condo growth could have declined due to the fear of buyers to live inside an enclosed space with hundreds of potential COVID19 carriers. The drop in Duplex growth could have been due to limited supply of units (BSP’s footnotes also points that way: Indices for duplex exhibit more volatility due to relatively small number of reported real estate loans).
An Exciting Tool
As you may have seen, the RREPI has a lot of great information that anyone and everyone could use and study. For this exercise, we will use the RREPI as our guide to examine the three economic factors and discover which affects it the most. From there, we could work out if the factors could be helpful in choosing the right property, be used as a buy or sell indicator or simply help improve buying or selling decisions.
Petition For Additional Data
There are a few other factors or variables that hopefully the Central Bankers could include in future reports as a supplementary material, since the data or information are already available to them.
Here are some that would be helpful:
1. The index or price change per city inside the NCR group – this could help show real estate investors and stakeholders the varying price growth from each individual city, which could then be used to aid buyers identify potentially profitable areas.
2. The index or price change of each type of property per city inside the NCR group – just like the first point, this could help everyone determine which type of property would be more rewarding or attractive in each individual city.
3. The volume of loan transactions – By including the volume of loan transactions, we will be able to spot if the rise in the index was due to an increase in the number of debtors or an increase in the value of loans.
4. Ratio of private sellers to real estate developers for each type of property – this will help us know the active sellers for a given period. I.e. Did private sellers outsold developers in the condo segment? From the answer, we’d know the sentiment of market players; if private sellers outsold developers, this could point out that new condo developments have stopped or inventories from developers have reached low levels, opening up opportunities for private sellers to potentially raise their asking price.
BSP computes the RREPI every quarter and publishes the computations every last Friday of the quarter. The next release should be on September 4 2021 and December 31 2021.
2 Money Supply/Domestic Liquidity (M3)
Now that we have an appreciation of the RREPI, we move to the Money Supply or Domestic Liquidity (The bankers use liquidity aggregate code “M3” and we’ll use that as our shortcut keyword for other examples)
For this particular exercise, the term Money Supply is equivalent to the term Domestic Liquidity or M3.
Well, why is Money Supply important? It’s for the simple reason that it influences inflation and interest rates, which then has an effect on real estate prices.
There are two general monetary policies for this are:
- Contractionary – they tighten money supply to dampen demand, leading to lower inflation, spurring high interest rates, less lending and borrowing, more savings and less spending.
- Expansionary – they loosen money supply, which lower interest rates, encourages more lending and borrowing, less savings and more spending.
For us to be on the same page, let’s quickly go through the definitions of Domestic Liquidity (M3).
Definitions
According to a monetary policy infographic issued by BSP last 2019, M3 or Domestic Liquidity serves as the money supply.
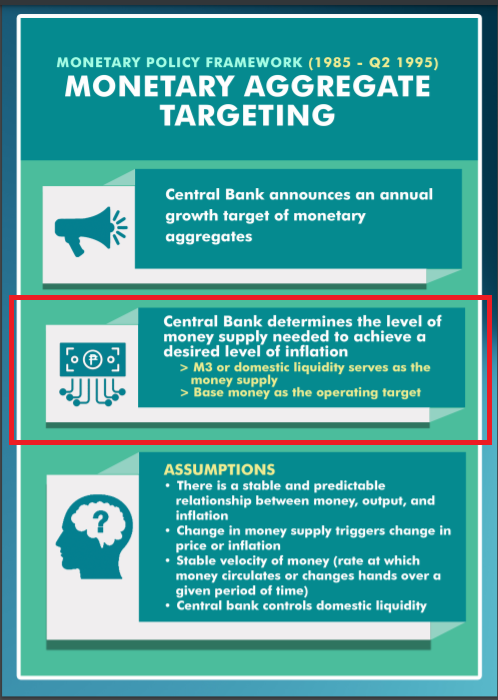
In the Depository Corporations Survey issued back in December 2018, BSP explained:
“M3 (Domestic Liquidity) include M2 and securities other than shares included in broad money (deposit substitutes).”
“Securities Other Than Shares Included in Broad Money are instruments used as an alternative form of obtaining funds from the public other than deposits through the issuance, endorsement or acceptance of debt instruments for the borrower’s own account. These represent all types of money market borrowings by banks like promissory notes, repurchase agreements, commercial papers/securities and certificates of assignment/participation with recourse.”
(Please note: M3 is a combination of codes M2 and M1; M2 consist of savings & time deposits while M1 is made up of currency in circulation & peso deposits)
Investopedia.com further explains M3:
“M3 was traditionally used by economists to estimate the entire money supply within an economy and by central banks to direct monetary policy in order to control inflation, consumption, growth, and liquidity, over medium and long-term periods.”
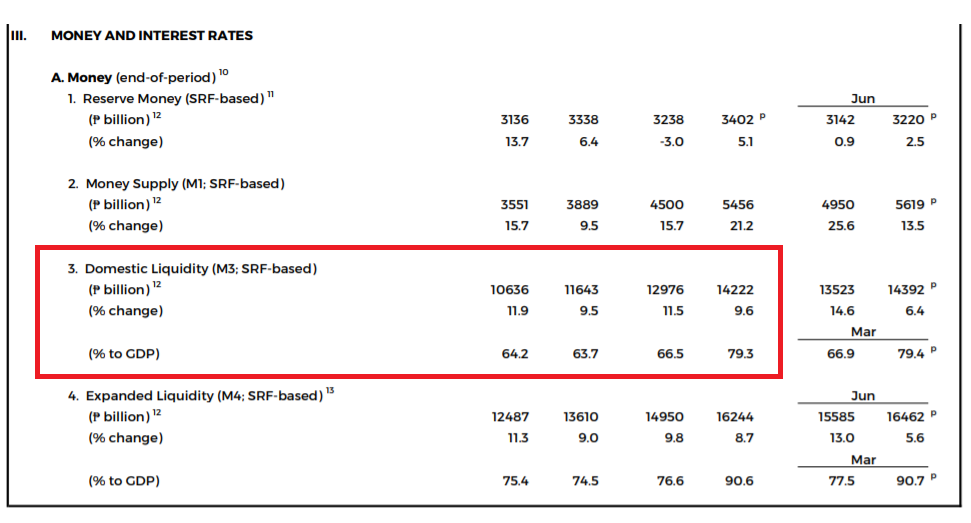
Alright, so now that Money Supply, Domestic Liquidity and M3 are clear to us, let’s take a look at BSP’s Selected Economic And Financial Indicators (SEFI) published last August 27 2021. Please note that in the SEFI report, Money Supply was classified as M1, but again, for this exercise, we will focus on M3.
Under Section 3 entitled Money and Interest Rates, Sub-section A, No. 3, we see this:
Peso in Billions: 2017 = ₱10636, 2018 = ₱11643, 2019 = ₱12976, 2020 = ₱14222
 Plotting it would show us this: (Note that data from <2016 was not included in the report)
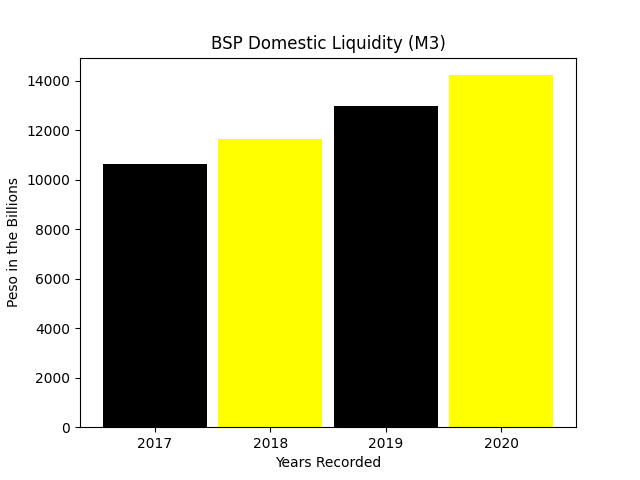
The annual supply of Peso continued to rise, reaching ₱14.2 Trillion.
In a speech at the 24th Membership Meeting of the Rotary Club of Manila last January 6 2021, BSP Governor Diokno said,
“Domestic liquidity continues to grow at a double-digit pace, rising by 11.8 percent to around ₱13.5 trillion in October, albeit slightly slower than the 12.2-percent growth in September.”
On page 13 of the recently published BSP Economic and Financial Developments for Q1 2021, they reported that,
“Money supply or M3 grew by 8.3 percent (preliminary) y-o-y as of end-March 2021 to about ₱14.2 trillion, slower than the 9.6-percent expansion as of end-December 2020.”
It further noted,
“The deceleration in M3 growth in March was due mainly to the sustained decline in claims on the private sector. In particular, credit extended to the private sector declined by 2.7 percent in March following a 0.3-percent contraction in the previous quarter as bank lending remained weak.”
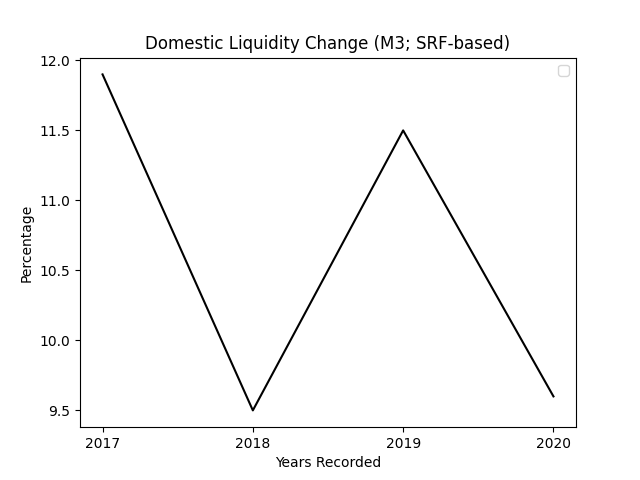
Here’s a plot of the annual Domestic Liquidity (M3) % Change:
2017 = 11.9%, 2018 = 9.5%, 2019 = 11.5%, 2020 = 9.6%
 A combination of the (1) Residential Real Estate Price Index, (2) Domestic Liquidity and (3) Domestic Liquidity Change:
 From simply “eyeballing” the charts, we could see that RREPI and Domestic Liquidity (M3) moved in tandem. Here’s a closer look…
RREPI = Blue. M3 = Purple.
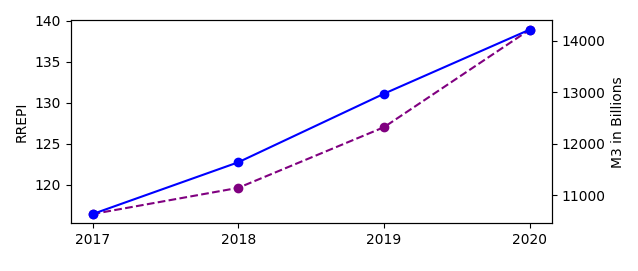
But “eyeballing” is not a reliable method so, let’s use some math magic.
Pearson Correlation Coefficient
We can use the Pearson Correlation Coefficient to measure the relationship between two variables. The formula is shown below.
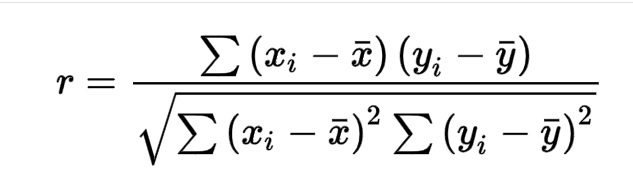
r = correlation coefficient
x(i} = values of the x-variable in a sample
\bar{x}= mean of the values of the x-variable
y_{i} = values of the y-variable in a sample
\bar{y}= mean of the values of the y-variable
The Pearson Correlation Coefficient ranges between 1.0 and -1.0. 1.0 means perfect positive relationship and -1.0 means perfect negative relationship. In a perfect negative relationship, the two variables move in opposite directions.
Calculating the Pearson Correlation Coefficient of the RREPI and Domestic Liquidity (M3) in Python using Numpy will show us a correlation coefficient of 0.98.
In our sample, we could infer that the RREPI and Domestic Liquidity will move together 98% of the time.
Simple Linear Regression
We can also use Simple Linear Regression to measure the association of an independent variable/predictor (in our case, the M3) to a dependent variable/outcome (RREPI) and predict the value of RREPI this 2021. Simple Linear Regression is one of the most commonly used statistical techniques to predict or forecast future values.
It has the formula: y=bx+a
Where (y) is the value that we will try to predict or forecast, (b) is the slope, (x) is the independent variable and (a) is the y-intercept.
One of the most important things to note here would be the R^2 symbol (pronounced R-squared). The R-Squared is a measure of how good our prediction would be. It ranges from 1 to 0. A value of 1 would be perfect, 0 would be worthless and a value of .80 or above would be our acceptable level of correlation. For this, I’ll just use LibreOffice’s Calc.
Here are the results:
Coefficients | |
Intercept | 48.22 |
M3 | 0.006245 |
R^2 | 0.95 |
A quick interpretation of the numbers:
If M3 was ₱0, the value of RREPI would be 48.22. For every ₱1Billion increase in M3, RREPI increases by 0.006245.
Plotting the linear regression line:
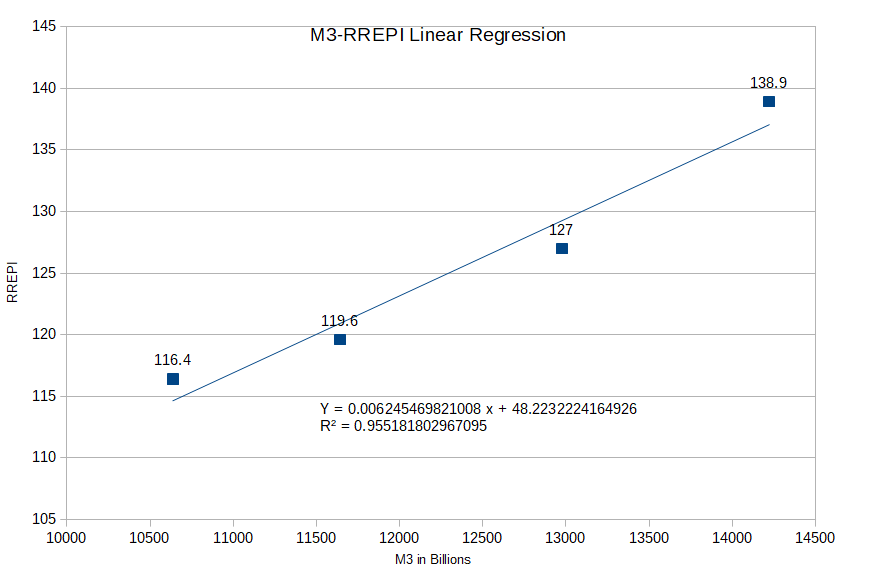 Our R^2 is 0.96, which means our model is able to predict the value of RREPI by 96%. Here are the predictions:
Year | M3 | Predicted RREPI | Actual RREPI | Residual |
2017 | 10636 | 114.65 | 116.4 | 1.75 |
2018 | 11643 | 120.94 | 119.6 | -1.34 |
2019 | 12976 | 129.26 | 127 | -2.26 |
2020 | 14222 | 137.05 | 138.9 | 1.85 |
2021 | 15858 | 147.26 | N/A | N/A |
As you can see in the table, our predictions came close to the actual RREPI.
For the year 2021, if the BSP raise M3 by 15% and it reaches ₱15.8 Trillion, our model puts the value of RREPI (for all types of housing in the entire archipelago) to 147.26. We will be able to validate this by December 2021 or January 2022.
In the book BSP Unbound: Central Banking and COVID-19 Pandemic in the Philippines, page 21, the BSP reports that,
“In the Philippines, the BSP undertook unprecedented measures to ensure adequate domestic liquidity, shore up market confidence and sustain the flow of credit to support growth (Glindro et al., 2020). The BSP measures are estimated at about ₱1.3 trillion, equivalent to 6.4 percent of the country’s GDP (Diokno, 2020).”
Correlation Does Not Imply Causation
That is correct. It’s very important to note that correlation does not necessarily equal to causality; The increase in M3 and RREPI might just be the result of random chance and that they don’t really have a relationship. It could also be that the result of the two variables increasing at the same time is caused by a third unknown variable (in statistics, they call it confounder).
BUT, for this example, we know that the purpose of BSP for increasing or expanding M3 is to “lower interest rates, encourages more lending and borrowing, less savings and more spending”. More available and disposable Piso in circulation means more money for you and I and other Filipinos to use in the purchase of residential properties. So, there is, indeed, a cause and effect situation happening between M3 and RREPI.
Just for good measure, let’s take a look at the Pearson Correlation Coefficients and R^2 of each individual property type in the NCR group to M3.
Type | Pearson Correlation Coefficient | R^2 |
Condo | 0.98 | 0.96 |
House | 0.72 | 0.51 |
Townhouse | 0.48 | 0.23 |
Duplex | 0.03 | 0.00 |
Condo units in NCR showed the highest Pearson Correlation Coefficient and R^2, which could mean that it is the most affected when M3 moves.
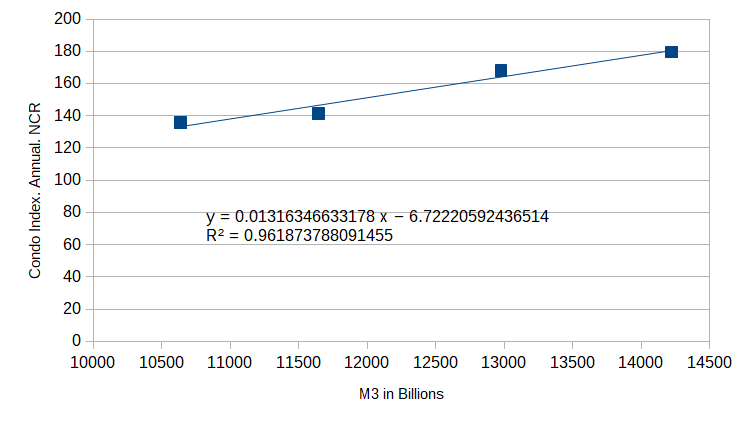
Here’s the Simple Linear Regression plot:
 And our predictions…
Year | M3 | Predicted Condo Index | Actual Condo Index | Residual |
2017 | 10636 | 133.28 | 135.8 | 2.52 |
2018 | 11643 | 146.54 | 141.2 | -5.34 |
2019 | 12976 | 164.09 | 167.9 | 3.81 |
2020 | 14222 | 180.49 | 179.5 | -0.99 |
2021 | 15858 | 202.02 | N/A | N/A |
Our model predicts that if BSP hits ₱15.8 Trillion (and real estate loans for condo units continue to be served or taken out) the Condo index in NCR would be around 202.02, a 12.55% increase from 2020. Again, we will have to wait until December 2021 or January 2022 to validate this.
3 (Price) Inflation Rate
“Inflation is a disease of money.”

I like that description. It comes from Jens O. Parsson’s book Dying of Money: Lessons of the Great German and American Inflations.
A commonly held belief is that if the prices of goods and services increase, so too, would the prices of residential real estate properties, BUT, that’s not always the case, as we will see later.
For the Philippine Statistics Authority’s (PSA) Inflation report, we first have to understand what Consumer Price Index (CPI) and Core Inflation are.
PSA defines Consumer Price Index as,
“The CPI is an indicator of the change in the average retail prices of a fixed basket of goods and services commonly purchased by households relative to a base year.”
And its use case?
“The CPI is most widely used in the calculation of the inflation rate and purchasing power of the peso.“
You can read more about it here.
For Core Inflation, PSA defines it as,
“the year-on-year rate of change of the monthly headline CPI after excluding food and energy items. Headline inflation is the rate of change in the overall consumer price index (CPI) currently published by the National Statistics Office (NSO).”
Moreover, BSP describe it as,
“a widely used measure of the underlying trend or movement in the average consumer prices. It is often used as a complementary indicator to what is known as “headline” or Consumer Price Index (CPI) inflation.”
And the difference between Core Inflation and CPI/Headline Inflation?
“Headline inflation thus captures the changes in the cost of living based on the movements of the prices of items in the basket of commodities and services consumed by the typical Filipino household”
While,
“core inflation measures the change in average consumer prices after excluding from the CPI certain items with volatile price movements.”
You can read further here: Core Inflation And The Estimation Of Core Inflation
The Consumer Price Index
Now, we dig deeper. Let’s take a look at PSA’s Summary Inflation Report Consumer Price Index (CPI), that was released last July 6 2021.
Their website provides two downloadable excel files. The first file is called the ‘Statistical Table’. (click here to download the xlsx file)
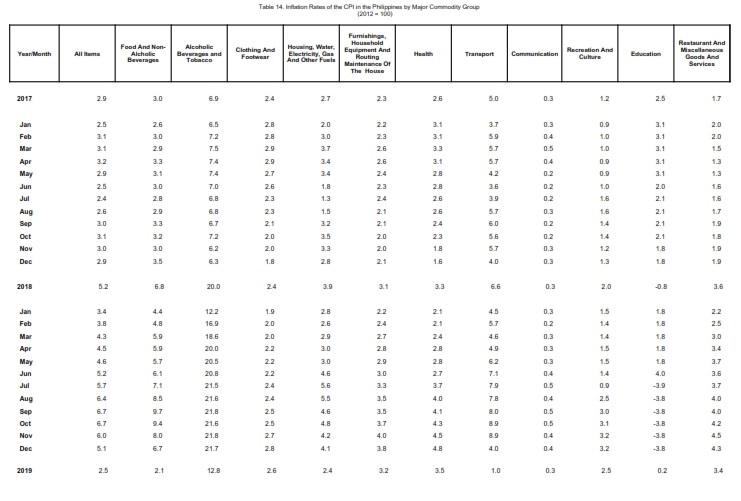
This document has 16 Tables. The one we’re after is Table 14 entitled, “Inflation Rates of the CPI in the Philippines by Major Commodity Group”.
The table starts from the January 2013 until June 2021 and contains of the following:
- Food And Non-Alcholic Beverages,
- Alcoholic Beverages and Tobacco,
- Clothing And Footwear,
- Housing, Water, Electricity, Gas And Other Fuels,
- Furnishings, Household Equipment And Routing Maintenance Of The House,
- Health,
- Transport,
- Communication,
- Recreation And Culture,
- Education,
- Restaurant And Miscellaneous Goods And Services.
We extract the important part, which is the annual average of the Inflation Rates of the CPI:
2016 = 1.3%, 2017 = 2.9%, 2018 = 5.2%, 2019 = 2.5%, 2020 = 2.6%
If we plot BSP’s Residential Real Estate Price Index annual summary and the annual average of the Inflation Rates of the CPI in the Philippines by Major Commodity Group, we get this:
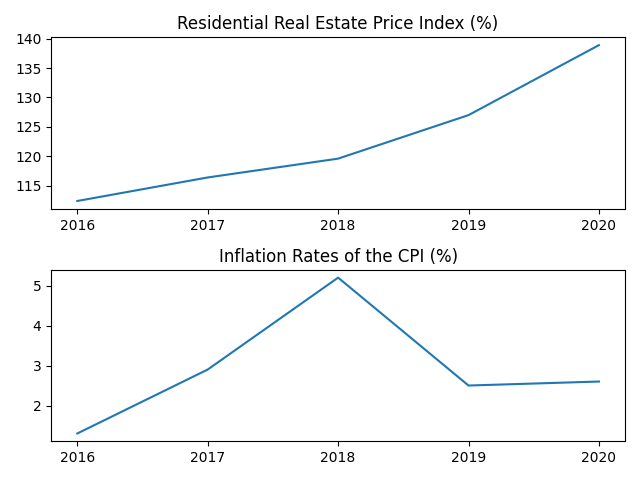
While the RREPI continued to rise, the Inflation Rates of the CPI stabilized in 2019 & 2020.
Remember I said that Money Supply/Domestic Liquidity/M3 influences Inflation? Let’s add the liquidity change and see what comes out.
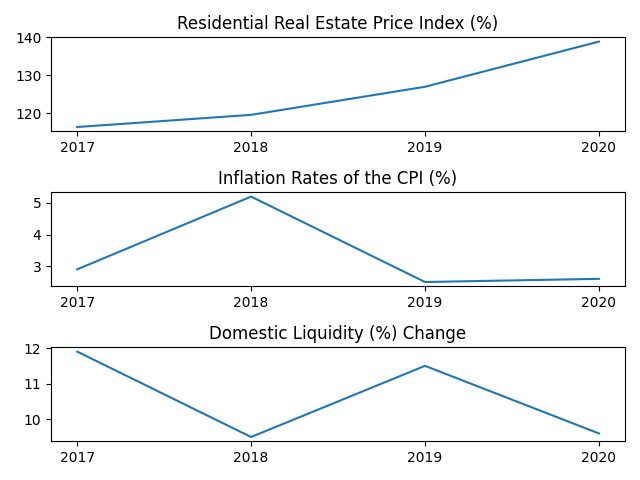
At first glance, we could see that there looks to be an inverse relationship between the Inflation Rates of the CPI and Domestic Liquidity (M3) % Change; When the BSP contracts M3, Inflation Rates of the CPI increases, when M3 expands, Inflation Rates of the CPI decreases.
Computing the Pearson Correlation Coefficient would show us this result: -0.55
An interpretation for this could be that, in our four year sample, 55% of the time they will move opposite of each other.
The second downloadable excel file is entitled ‘Core CPI and Core Inflation Rates in the Philippines’. (click here to download the xlsx file).
From here, we focus only on the Core Inflation Rates:
2016 = 1.6%, 2017 = 2.4%, 2018 = 4.2%, 2019 = 3.2%, 2020 = 3.2%
The plots would show us this…
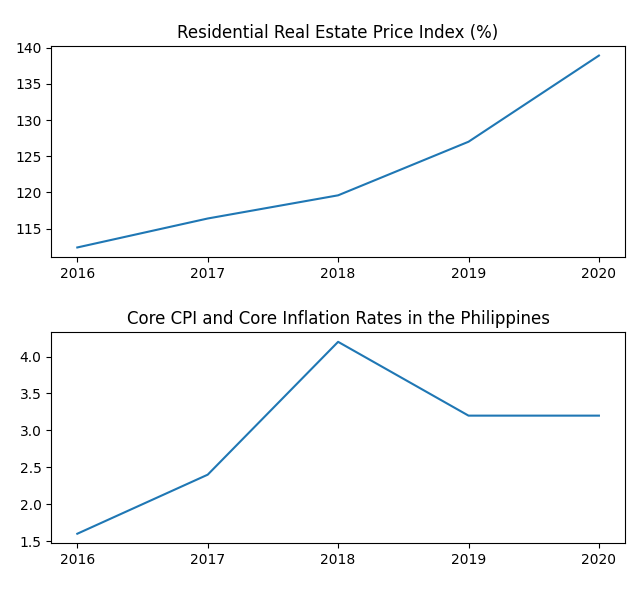
And when we put together the RREPI, Inflation Rates of the CPI and Core Inflation Rates, we get this:
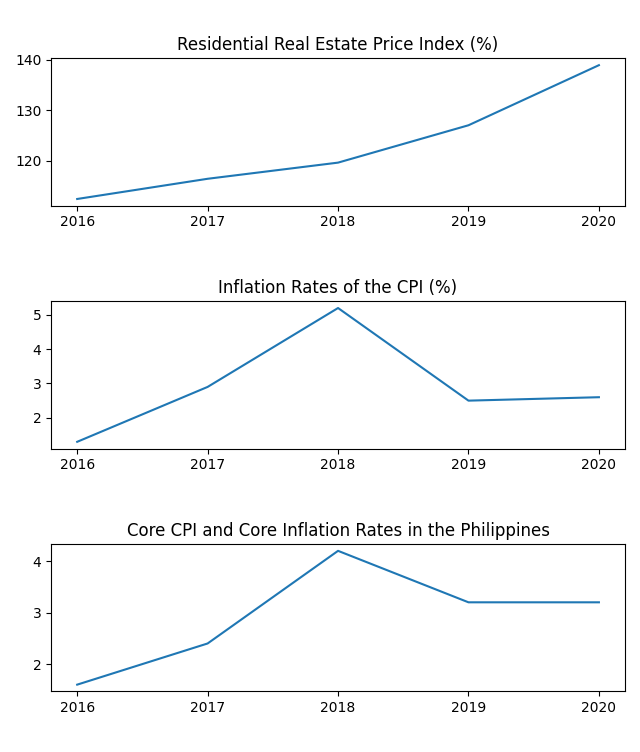
Our plots show that even though the Inflation Rates of the CPI and Core Inflation Rates dropped and moved sideways, the RREPI continued its upward trajectory.
The table below shows the Pearson Correlation Coefficient of the indexes of the different types of properties in NCR to the Inflation Rates of the CPI and Core Inflation Rates.
Type | CPI | Core |
Townhouse | 0.72 | 0.88 |
Duplex | 0.50 | 0.84 |
Single Detached/Attached House | -0.06 | 0.18 |
Condo | -0.009632 | 0.44 |
It’s quite interesting. Out of the four types of properties, the Townhouse index showed a correlation coefficient of 72% to the Inflation Rates of the CPI and 88% to the Core Inflation Rates. Duplex reached a 50% correlation coefficient to the Inflation Rates of the CPI and 84% to the Core Inflation Rates.
Townhouse and Duplex properties were notably more affected by Inflation than Single Detached/Attached Houses and Condos. We can see it in the plot below.
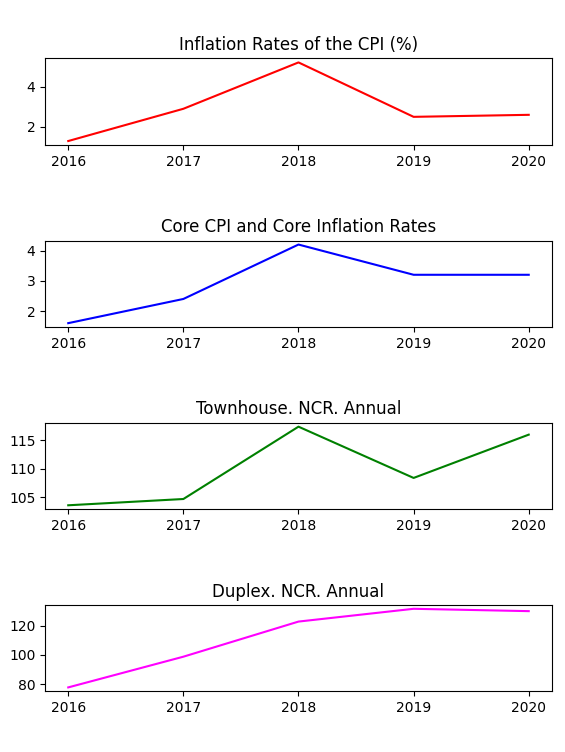
From the sample, we can say that Townhouse and Duplex owners in NCR can potentially use the inflation rates to help guess the growth of their properties.
BSP Inflation Targeting
The BSP would do everything it can to manage the country’s inflation. This function is written in stone.
Under Republic Act No. 7653 or The The New Central Bank Act, Section 61. Guiding Principle:
“The Monetary Board shall endeavor to control any expansion or contraction in monetary aggregates which is prejudicial to the attainment or maintenance of price stability.”
Found on the BSP website: Price Stability – Inflation Targeting: The BSP’s Approach to Monetary Policy
“Inflation targeting is focused mainly on achieving a low and stable inflation, supportive of the economy’s growth objective. This approach entails the announcement of an explicit inflation target that the BSP promises to achieve over a given time period.”
“To achieve the inflation target, the BSP uses a suite of monetary policy instruments in implementing the desired monetary policy stance, depending on its assessment of the outlook for inflation.”
In the 2021 Firs Quarter Inflation Report, they have set the annual headline inflation (CPI Inflation) target to 3.0% ± 1.0% for 2021-2022 and set at the same rate for 2023-2024.
Hypothetically, if you bought a Townhouse in NCR back in 2018, you may want to hold on to it and wait a little more before selling.
4 Lending Rate
Finally, we come to the Lending Rate.
Unfortunately, BSP does not have a section for “Mortgage Rate”, so for this part, we will use “Lending Rate”. Please note that Lending Rate has two sub-subsections; Nominal Interest Rate and Real Interest Rate.
Simply put, Nominal Interest Rate is the interest rate before deducting the inflation rate. This is the rate that banks advertise on TV, print and social media. Real Interest Rate on the other hand is the interest rate after deducting the inflation rate.
Our data would come from BSP’s Selected Economic And Financial Indicators (SEFI) that was published last August 6 2021.
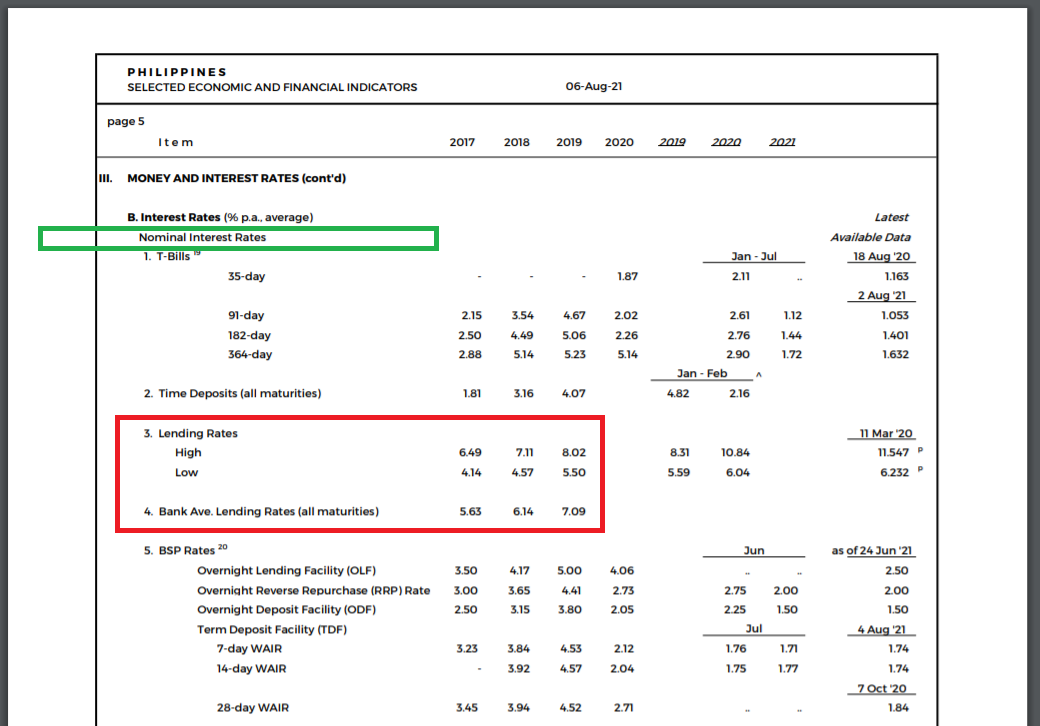 We extract the data from Section 3, Money And Interest Rates (cont’d), sub-section B, numbers 3 & 4:
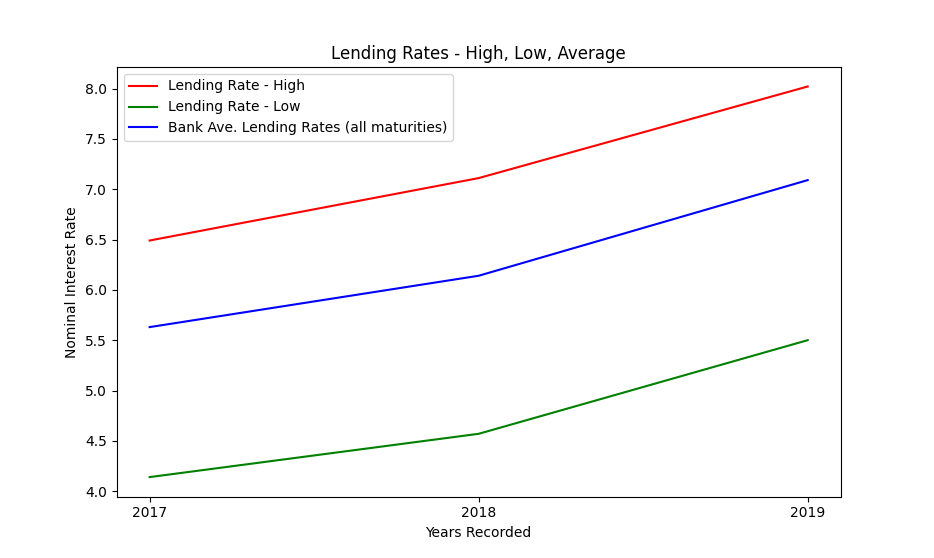
Lending Rates – High: 2017 = 6.49, 2018 = 7.11, 2019 = 8.02
Lending Rates – Low: 2017 = 4.14, 2018 = 4.57, 2019 = 5.50
Ave. Lending Rates (all maturities): 2017 = 5.63, 2018 = 6.14, 2019 = 7.09
If we plot these, we get the following:
 Now, let’s place the rates side by side with the RRPEI:
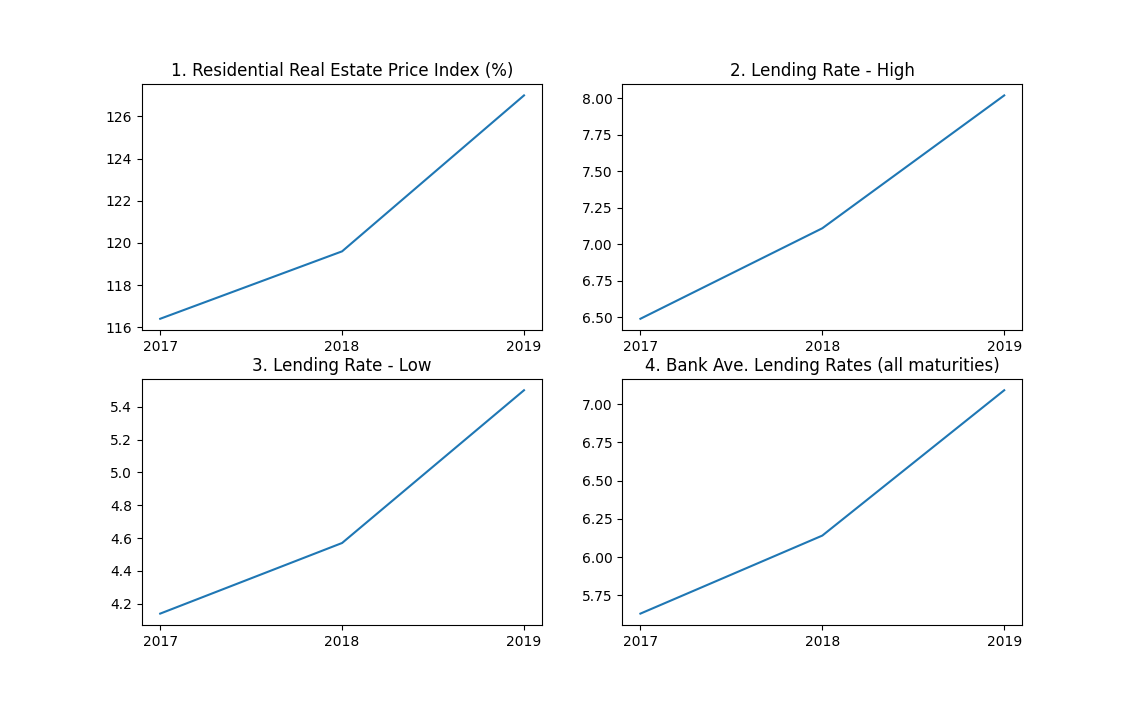 In the 3-year range, the index mirrors the lending rates! And if we calculate the Pearson Correlation Coefficient, we will have this:
RREPI | |
Lend Rates-High | 0.99 |
Lend Rates-Low | 0.99 |
Avg. Lend Rates | 0.99 |
The RREPI and Lending Rates have perfect correlations, at least in our 3-year sample. Which would mean that a movement from the rates would have a high chance of influencing the RREPI.
Here’s a good resource from the BSP that you could further read regarding interest rates: PDF
A few great excerpts:
“What is the BSP’s policy on interest rates? Does the BSP regulate the interest rate charged by banks, lending investors and pawnshops?
Since 1983, the BSP has followed a market‐oriented interest rate policy. That is, it allows the market to set its own rates. Thus, the BSP does not regulate the interest rate charged by banks, lending investors and pawnshops.“
“Why are interest rates not the same in all banks?
The cost of doing business varies from bank to bank and this is reflected in the different lending rates charged by the banks.”
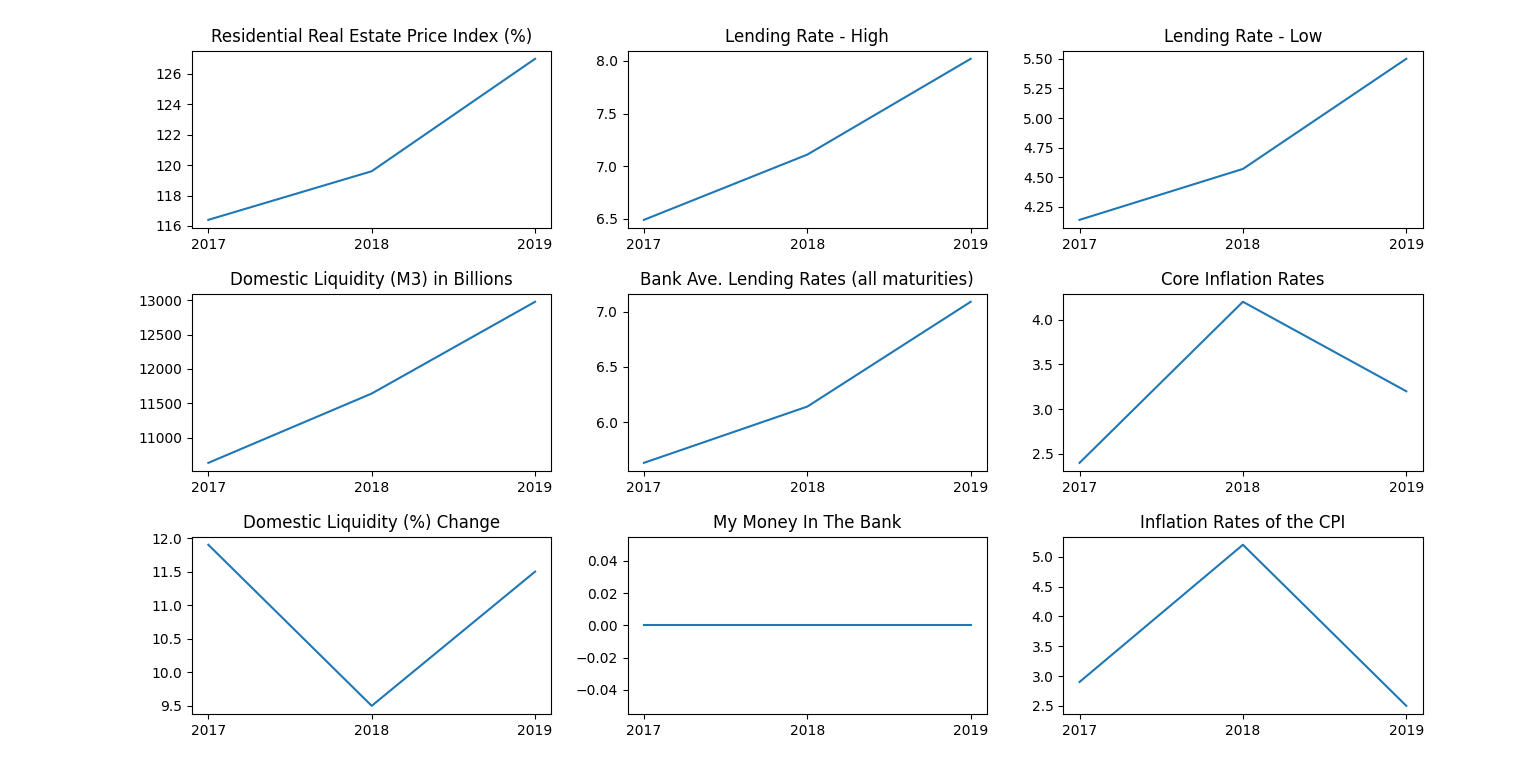
Combining the essential plots will show us this:
 5 Summary
We could conclude a lot of great things with our little exercise but the top for me would be:
The RREPI rises as a whole, but the velocity of the rise of each individual type of property vary from one another. By having awareness on these variations, real estate players can potentially make generous profits from the fast rising ones and take advantage of possible opportunities from the rest.
We have measured the relationship of the RREPI to the Money Supply/Domestic Liquidity/M3 and saw a strong correlation between the two. All things being equal, if BSP continue to expand M3 and real estate loans continue to be served by the banks and taken out by the public, our prediction of the RREPI reaching 147.26 might prove to be correct and if so, sellers could possibly enjoy more profits.
Condo units in NCR showed significant relationship with M3. Compared to the other types of properties, it can still be considered as concrete gold. New players entering the market will be better served if they begin with Condos rather than higher risk properties such as Duplexes.
The Townhouse and Duplex indexes in NCR exhibited high correlation with the Inflation Rates of the CPI and Core Inflation Rates.
The RREPI also showed high correlation with Lending Rates, but since M3 influence both Inflation and Lending Rates, we could circle back to M3 and infer that M3 is the best indicator among the three economic factors for buying or selling.
Now that we have a good sense of the relationship of the Philippine Residential Real Estate Index to the Money Supply/Domestic Liquidity/M3, Price Inflation and Lending Rate, we could potentially have a better assessment on the type of properties that would make better returns, when to possibly buy, sell or hold them and at the very least, I hope it could help improve the decision making process.
New players who’d like to enter the real estate game and people who wish to purchase their first owned-residence would find it to be in their best interest to be cognizant of BSP’s actions. Current players should also be still mindful of the economic direction and not be over confident with their positions.
Now that we have a few pieces of the puzzle in place, we can move to take a look at the other pieces, such as the COVID19 situation (i.e. effect of cases per month, quarter, year on the index) and goverment regulations (effect of lockdowns on the index). See you in the next article.
This exercise has been fun. I appreciate that you’ve taken the time to read it. I wish you the best of luck with your current or future real estate transaction!
Cheers!


