

Back in September of 2021, we published RESIDENTIAL REAL ESTATE PRICE INDEX AND ITS RELATIONSHIP WITH MONEY SUPPLY, PRICE INFLATION & LENDING RATE.
In that piece, our simple linear regression model tried to predict the 2021 values of the BSP/Central Bank’s Residential Real Estate Index and Domestic Liquidity level, also known as M3. Please note that this year, the Central Bank changed the title of Domestic Liquidity to Broad Money.
Domestic Liquidity Definition from the Depository Corporations Survey October 2021
Here are the results
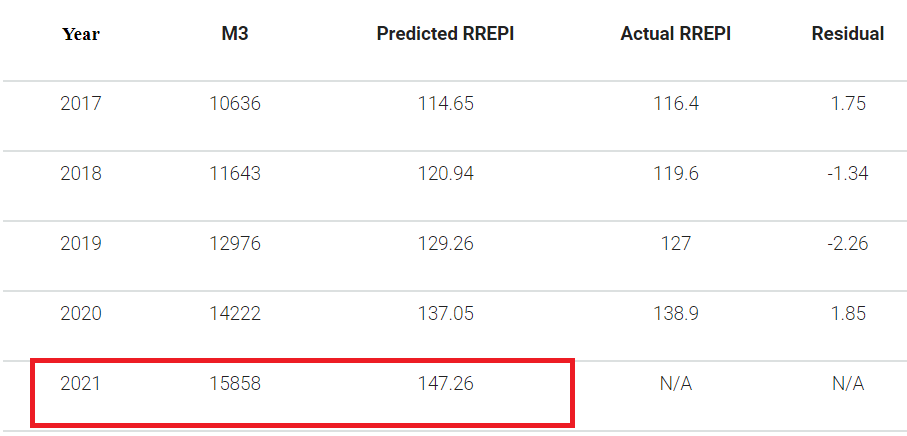
Predicted RREPI – 147.26
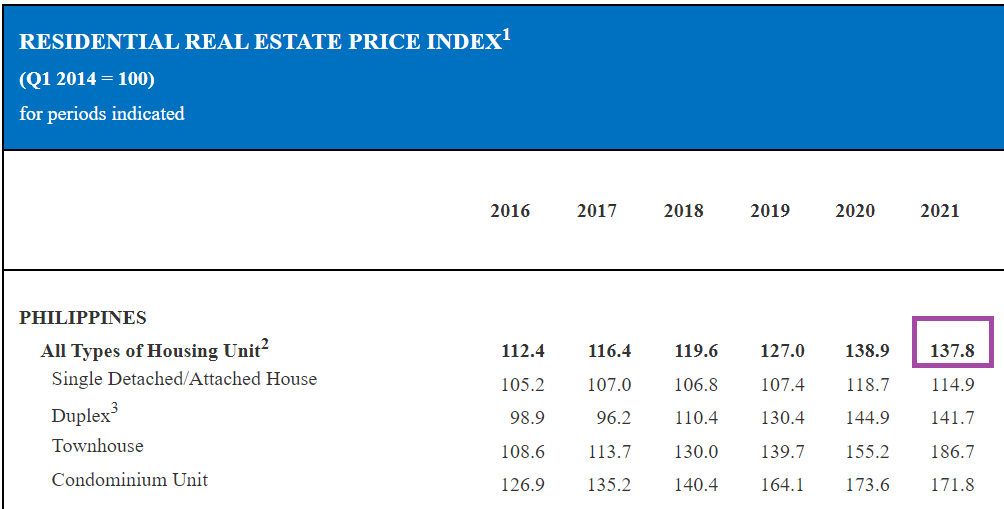
Actual RREPI – 137.8
Residual – 9.46
Predicted M3 – 15858 (₱15.8 Trillion)
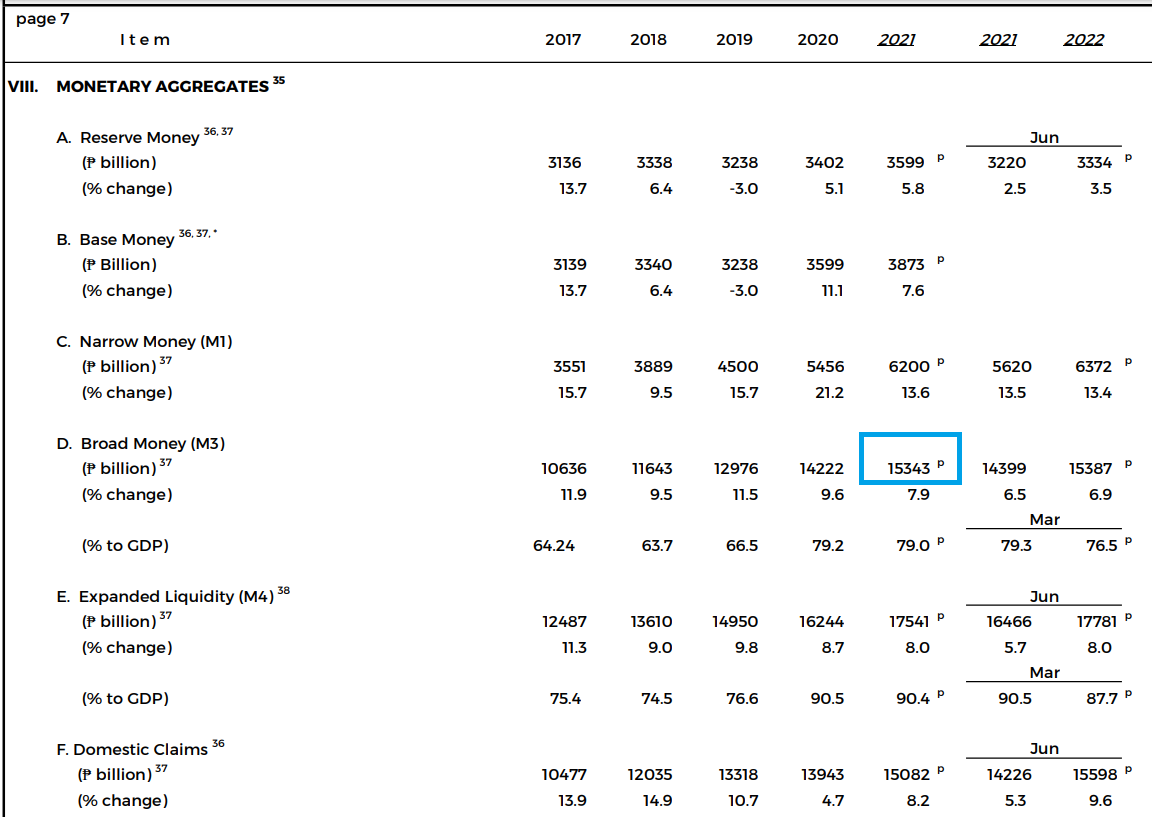
Actual M3 (Domestic Liquidity) – 15343 (₱15.3 Trillion)
Residual – 515 (in Billion)
Below is a screenshot of the table showing our model’s prediction of the RREPI & M3.
And here are the actual RREPI and M3. Screenshots taken from the BSP website.
What went wrong
The RREPI prediction was off the actual value by 9.46, quite a big number if compared to the other predictions which were only off by +/- 1 or 2 points.
This error is the result of the model’s lower M3 prediction. The model predicted that the BSP would increase its M3 to ₱15.8 Trillion by 2021, but it only got to ₱15.3 Trillion, which put the model off by -₱515 Billion. Domestic liquidity (M3) expanded by only 7.9% while the model predicted it to reach 11.5%.
One of the most probable cause for BSP’s lower M3 is the country’s rising price inflation. A speech of former Central Bank Governor Diokno offers a clue.
In a speech by former Central Bank Governor Diokno at the Credit Suisse Briefing in Manila last February 17, he said,
“The BSP’s exit strategy will begin with the recalibration of the BSP’s monetary operations to ensure that our accommodative monetary policy translates to short-term interest rates.”
Noting that,
“Inflation and growth outlook over the medium term and the associated risks will continue to guide the timing and conditions of BSP’s exit strategy.”
Further stating,
“…the BSP is mindful of the need to strike a delicate balance between providing adequate stimulus to the economy and preventing the buildup of inflationary pressures and risks to financial stability.”
The Philippine Statistics Authority’s Summary Inflation Report Consumer Price Index for July 2022, released last August 5, gives us another clue.
In our previous blog, we extracted an infographic from BSP, to which a part of it reads,
“Central Bank determines the level of money supply needed to achieve a desired level of inflation.”
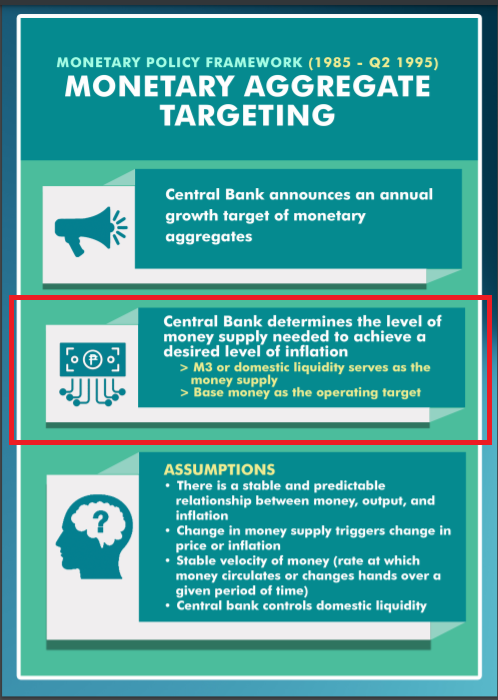
Adding these up, the Central Bankers may have lowered M3 in the hopes that it will slowdown price inflation.
Mr. Diokno was optimistic with BSP’s overall inflation outlook in his February 2022 speech, forecasting that,
“For 2021, using the new base year 2018, inflation averaged 3.9 percent. Our latest baseline forecast indicates that inflation is to settle at 3.7 percent in 2022 and 3.3 percent in 2023, well within the target range of 2 to 4 percent.”
The optimistic tone may have been influenced by February’s headline inflation of 3%. As of this writing, July headline inflation is at a high of 6.4%. We’re already on the second half of the year and BSP’s forecast may need some update.
BSP defines headline inflation as, “the rate of change in the CPI [Consumer Price Index], a measure of the average price of a standard basket of goods and services consumed by a typical family.”
Trouble in the construction sector
At this point, we’ll need to ring the alarm bells!
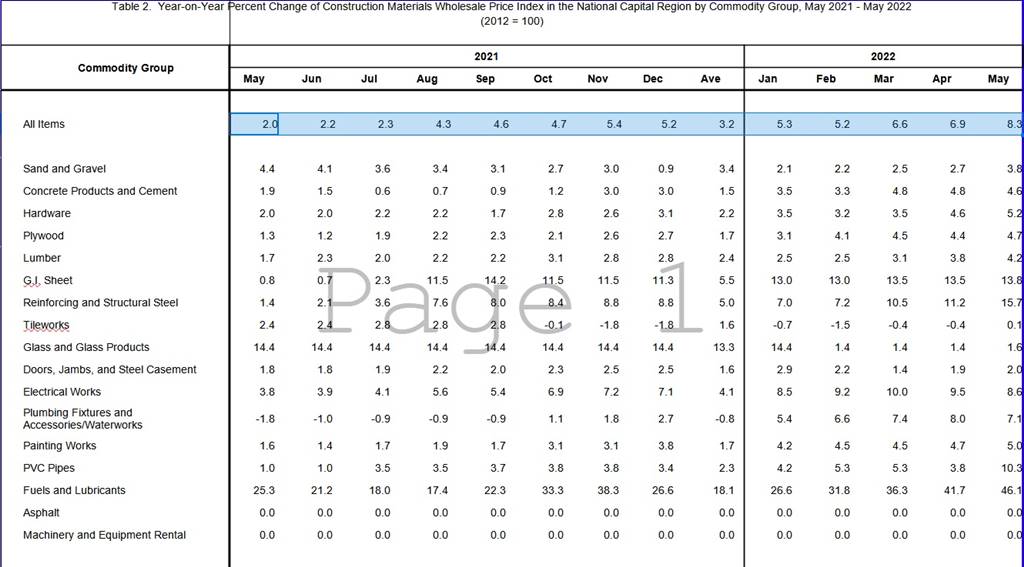
Here’s PSA’s May 2022 Construction Materials Wholesale Price Index in the National Capital Region, released last June 27. The downloadable statistics table shows the following data…
Here’s a bar chart to make you appreciate it more…
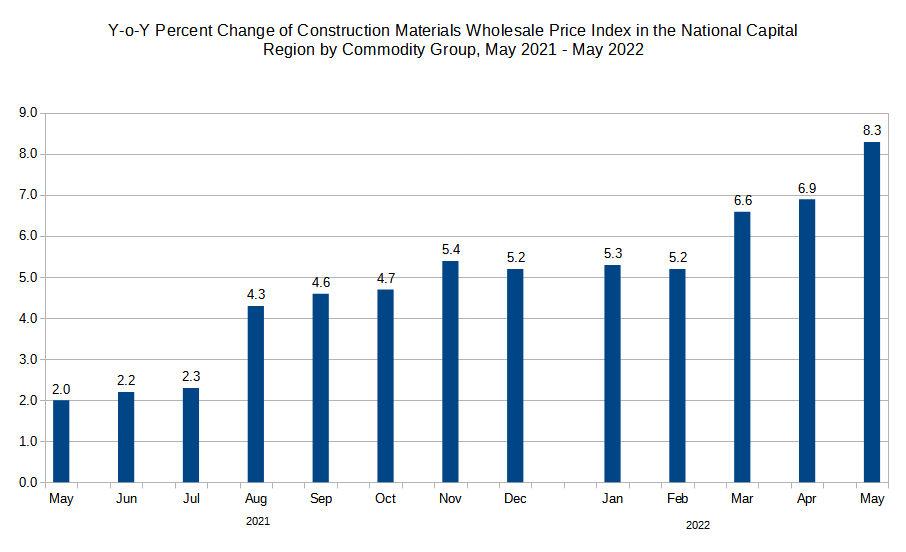
From May 2021 to May 2022, the index increased by 315%. It’s a huge leap compared to the data from May 2020 (1.3%) to May 2021 (2%), which was only an increase of 54%.
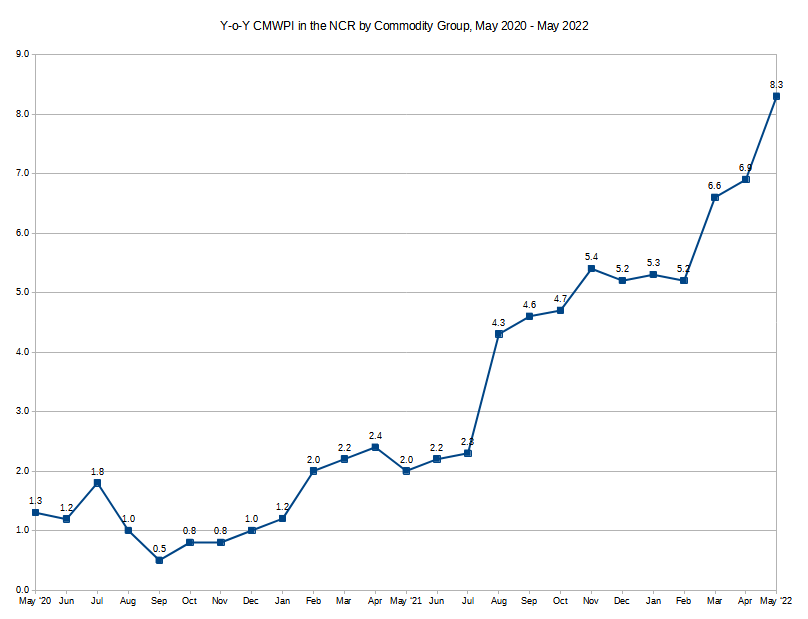
For better visual impact, here’s a chart containing the data from May 2020 to May 2022…
Average annual family income
The recent PSA Family Income and Expenditure Survey revealed that the 2021 average annual family income was ₱307,190 for the entire archipelago. A decrease of 2% from the 2018 annual income of ₱315,350.
Focusing on the families living in the NCR, their average annual income was ₱417,850 in 2021, a 9.2% drop from the 2018 annual average of ₱460,380. Average annual expenditure for 2021 was at ₱321,590. Doing the math, families were left with an extra ₱96,260 per year after expenses, which translates to ₱8,021 of extra money per month.
This income data will be come in handy in our thought process below.
What does this mean to us in real estate?
With a July headline inflation hitting 6.4 + 315% Y-o-Y rise in the CMWPI + 9.4% drop in the average annual income of families living in the country’s capital, this spells trouble in the real estate industry.
The Philippine Constructors Association Inc (PCA). has already appealed to the government for help. In an August 24 Philippine Star article entitled ‘Construction industry faces perfect storm‘, written by Iris Gonzales, she reports that the PCA has sent a letter to the Department of Trade and Industry, informing the government agency that,
“The cost and expenses borne by our contractors to avert the effects of the pandemic have not yet been fully recovered – resulting in partial and in some cases, a complete shutdown of operations. For others this also meant a discontinuation of their businesses”
If the rising prices persist and income continues to decline, we might see (based on our personal opinion):
- Fewer residential condominium and subdivision developments in the NCR being started in year 2023. Those that have already started development and sold out pre-selling units are locked-in to whatever total contract price they have given their clients.
- Fewer real estate developments will jeopardize the job security of construction workers, small construction material suppliers and everyone down the chain.
- The major residential developments that will be started in year 2023 will cost significantly higher, which in turn will price out (even more) the working middle-class.
- Many Filipinos in the lower and middle-class looking to construct their own homes may be forced to lower the quality of their build and/or decrease their intended floor area to accommodate the higher material prices.
- Maintenance and repair of existing homes will be expensive, giving landlords a reasonable excuse to push rental rates up.
It’s a winding punch aimed at the gut of every Filipino.
Politics
As much as we want to exclude politics in the equation, as we’ve tried to do in the previous blog, it’s really part and parcel of the problem and eventual solution. It cannot be excluded.
Statistics from reputable sources, can help us have a better, more grounded view of the state of our country and aide us in making informed decisions.
The unfortunate reality is, even if we implement cost-cutting, belt-tightening measures (i.e. lessen travels, save up more money, limit cappuccinos shots), it would all be worthless if we’re continually inundated with wildcard policies and actions by the government; There are plenty of recent examples that would show that priorities have not been for the good of the country.
So, what can we do?
- For buyers: if you have the capacity and need to purchase a property either via cash or mortgage, this year would be a good time to do it.
- For sellers: the answer is highly dependent on your financial need.
- For potential residential tenants: rental rates are still relatively affordable and there are still a good number of vacancies so you still have time to go shopping.
- For current residential tenants: if your rent is expiring soon and you plan to remain in the property you’re residing in, you may want to negotiate with your landlord to extend your rent and maintain the current rental rate. The success of this action would be highly dependent on the financial situation of your landlord. On the other hand, if you’re planning to upgrade, now would be a more practical time to look for another property.
- For residential landlords: if your property is located inside the NCR or other highly urbanized cities and the monthly rental price is equal to or less than ₱10,000, you are covered by Republic Act No. 9653 or known as the Rent Control Act of 2009. Under Section 4, Limit on Increases in Rent, it states that,
“the rent of any residential unit covered by this Act shall not be increased by more than seven percent (7%) annually as long as the unit is occupied by the same lessee”
- For everyone else, you’re on your own.
- I’m just kidding! As evidenced by the Rent Control Act, our elected politicians have the power to write laws that could ease the people’s burden. Write your representatives in Congress, your Senators, to, as for example, amend RA 9653 to increase the rental price threshold and make the increase in the threshold tax deductible for the landlord.
Thanks for taking the time to read this! Be safe out there!


