

Some disclaimers before we proceed: (1) Nothing here should be construed as financial advise. (2) I have tried to include accurate data, extracted directly from the sources with attached links for verification, but I cannot guarantee that the data from the said sources will remain unchanged by the time you have read this and if the data ever changed, that I am able to update it accordingly.
0 Introduction
Sales plunged. Rental vacancies soared. In a span of one year, this pandemic-a black swan event-has transformed Philippine real estate into a hole of depression. The millions of Pesos of potential income for the thousands of real estate participants vanished and was replaced with debt.
As I write this, I’m happy to say that market activity has started to slowly return; Sales transactions have resumed and rentals have begun to pick up pace.
Now would be the best time for us to take a step back and take a look at the effects of this once in a lifetime event to our beloved industry.
Numbers will tell the story but, every once in a while, I’ll add news clips and my personal experiences to provide additional depth.
Here’s a great quote from my favorite statistics professor and author David J. Hand regarding numbers:
“…numbers have only one property: their value or magnitude. Contrary to what fortune tellers may have us believe, numbers are not lucky or unlucky – in just the same way that numbers do not have a colour, or a flavour, or an odour. They have no properties but their intrinsic numerical value.”
-Taken from the book Statistics: A Very Short Introduction. Page 24.
Alright! Let’s get down to business.
To create this piece, I divided the task into two parts. First was aggregating the COVID-19 cases, quarantine classes and revenues of the real estate developers. The second part was measuring and analyzing the data.
The bulk of the work was data gathering, cleaning, measuring and finally, interpreting. It was quite an adventure! To understand the data that I was looking at and to be able share it with you, I used Visual Studio Code, Python (Pandas, Matplotlib) and LibreOffice.
1 Data Gathering
- COVID-19 Cases: the Department of Health’s Google Drive was the source- https://drive.google.com/drive/folders/1WaIOMDou4VGDjprYLLnrRJDe-t_gC1_N
- Quarantine Classifications: the Department of Health’s website, doh.gov.ph, was the main source but, when information were missing, I used alternative sources like www.officialgazette.gov.ph, www.facebook.com/HarryRoque (since he’s the official spokesperson of the government) and news agencies like newsinfo.inquirer.net.
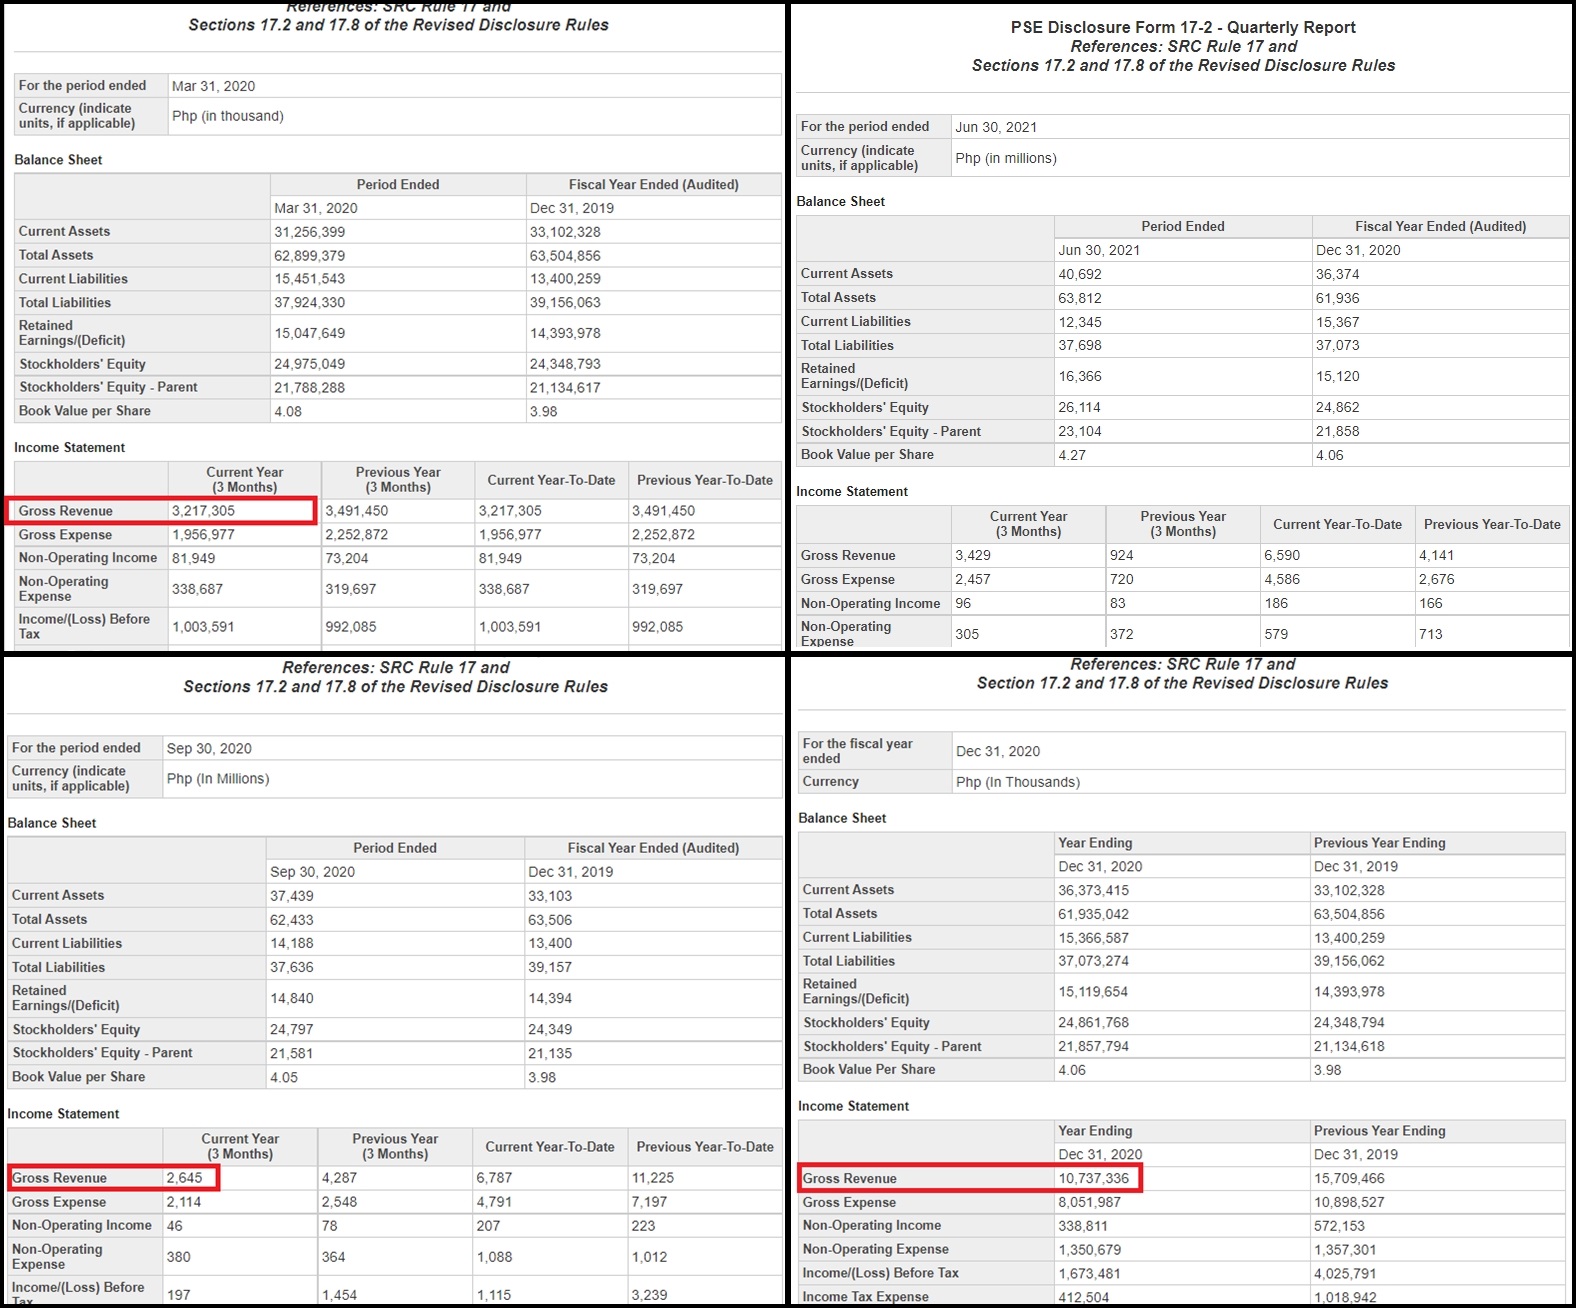
- Real Estate Developer Revenues: The Philippine Stock Exchange’s Edge website, edge.pse.com.ph, was the source for the revenues; PSE Form 17-2 for the Quarterly Report and 17-1 for the Annual Report.
2 Data Cleaning
Like in my previous piece, Philippine Residential Real Estate Price Index And Its Relationship With Money Supply, Price Inflation & Lending Rate, I wanted to focus on the National Capital Region, mainly because that’s the market I work in and familiar with and it’s the most active in terms of real estate transactions (sales, rentals, leases) in the archipelago.
2.1 Isolating COVID-19 Cases in NCR
To get to the actual statistics that were needed, one had to understand and comb through the 22 columns provided in the DOH’s CSV file;
CaseCode, Age, AgeGroup, Sex, DateSpecimen, DateResultRelease, DateRepConf, DateDied, DateRecover, RemovalType, Admitted, RegionRes, ProvRes, CityMunRes, CityMuniPSGC, BarangayRes, BarangayPSGC, HealthStatus, Quarantined, DateOnset, Pregnanttab, ValidationStatus
After some trial and error, I decided to focus only only on three specific columns; Sex, DateRepConf, RegionRes.
- Sex – The gender, not the deed (just so we’re on the same page)
- DateRepConf – Date publicly announced as confirmed case
- RegionRes – Region of residence
From there, it was simply filtering out the rest of the Regions and only retaining NCR cases but, one issue came up… there were
null values! See screenshot below.
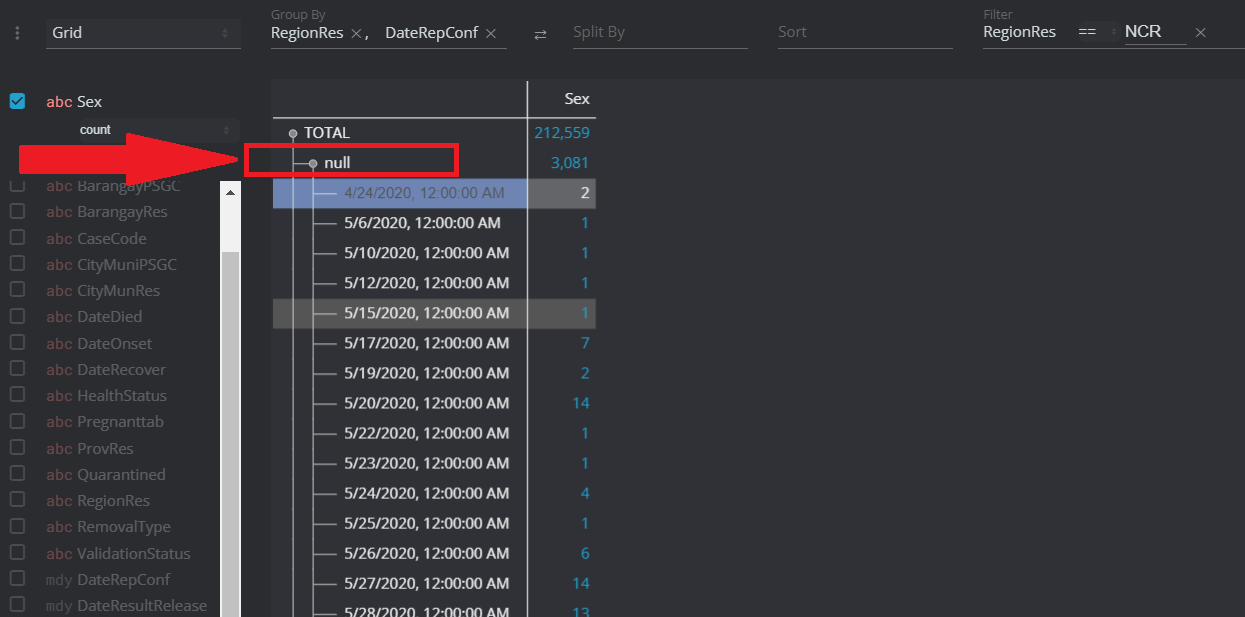
These null values were present both in the 2020 and 2021 records. Simply put, these null values are COVID-19 cases with missing information.
To resolve this issue, I opted to remove these null values and proceed only with the available NCR values.
I used Python’s Pandas library to isolate the NCR cases and count the total number: See Google Sheets
2.2 Quarantine Classifications
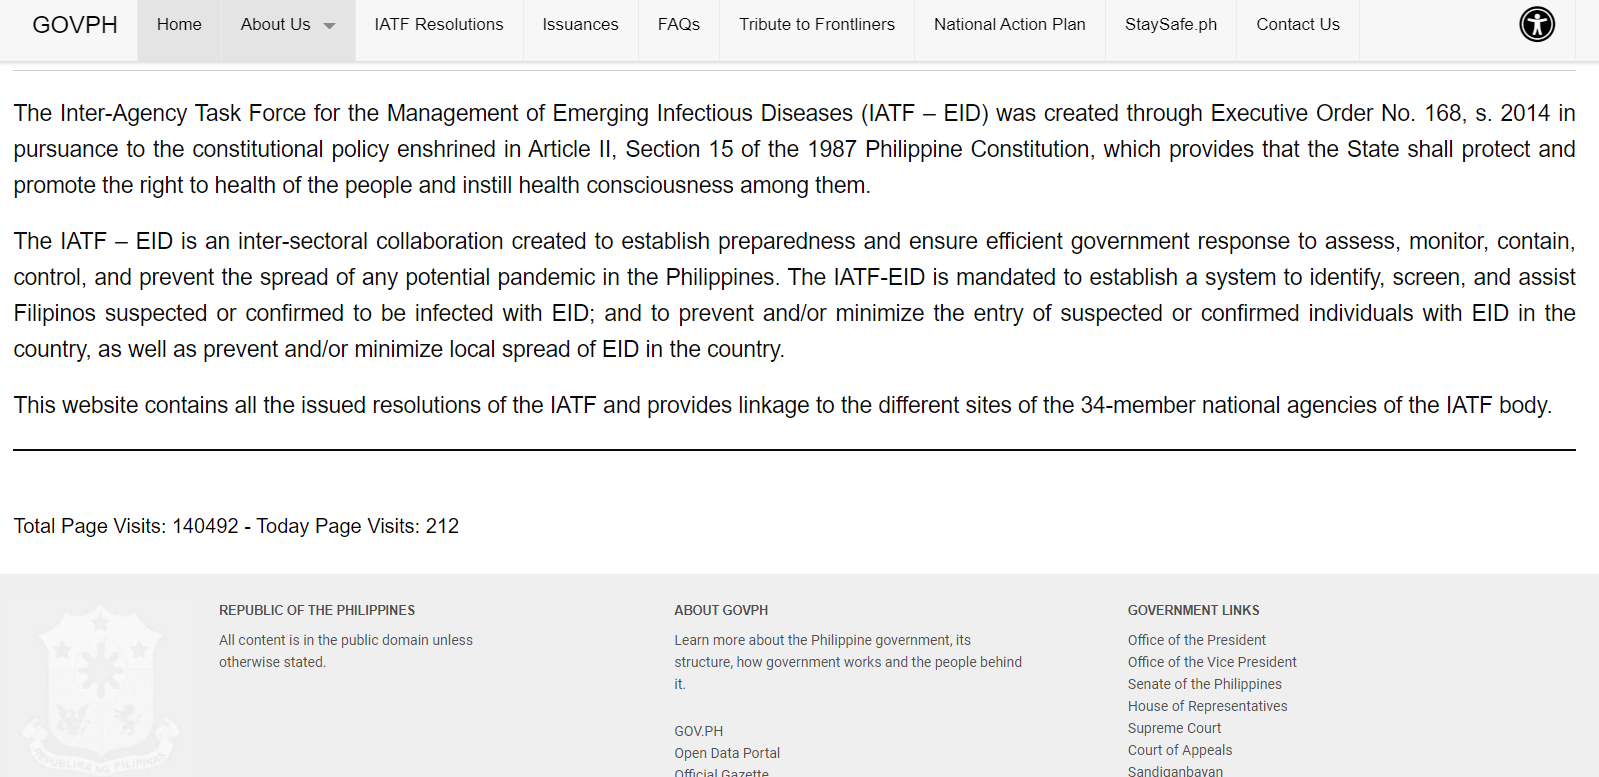
Only on October 23, 2021, did I learn that the Inter-Agency Task Force for the Management of Emerging Infectious Diseases (IATF-EID or just ‘IATF’) has its own website: iatf.doh.gov.ph
When I started writing the draft and searched for the resources for this piece back in September 2021, the website never appeared on the search engine’s results page.
Looking at the website’s visit counter, there have been 140,492 site visits during the time I viewed it.
 I checked age of the domain but all of the domain age checkers returned the age of the website as 0 years and 0 months old.

I then checked the media files and found that most of it were uploaded only last February 2021.
See here…
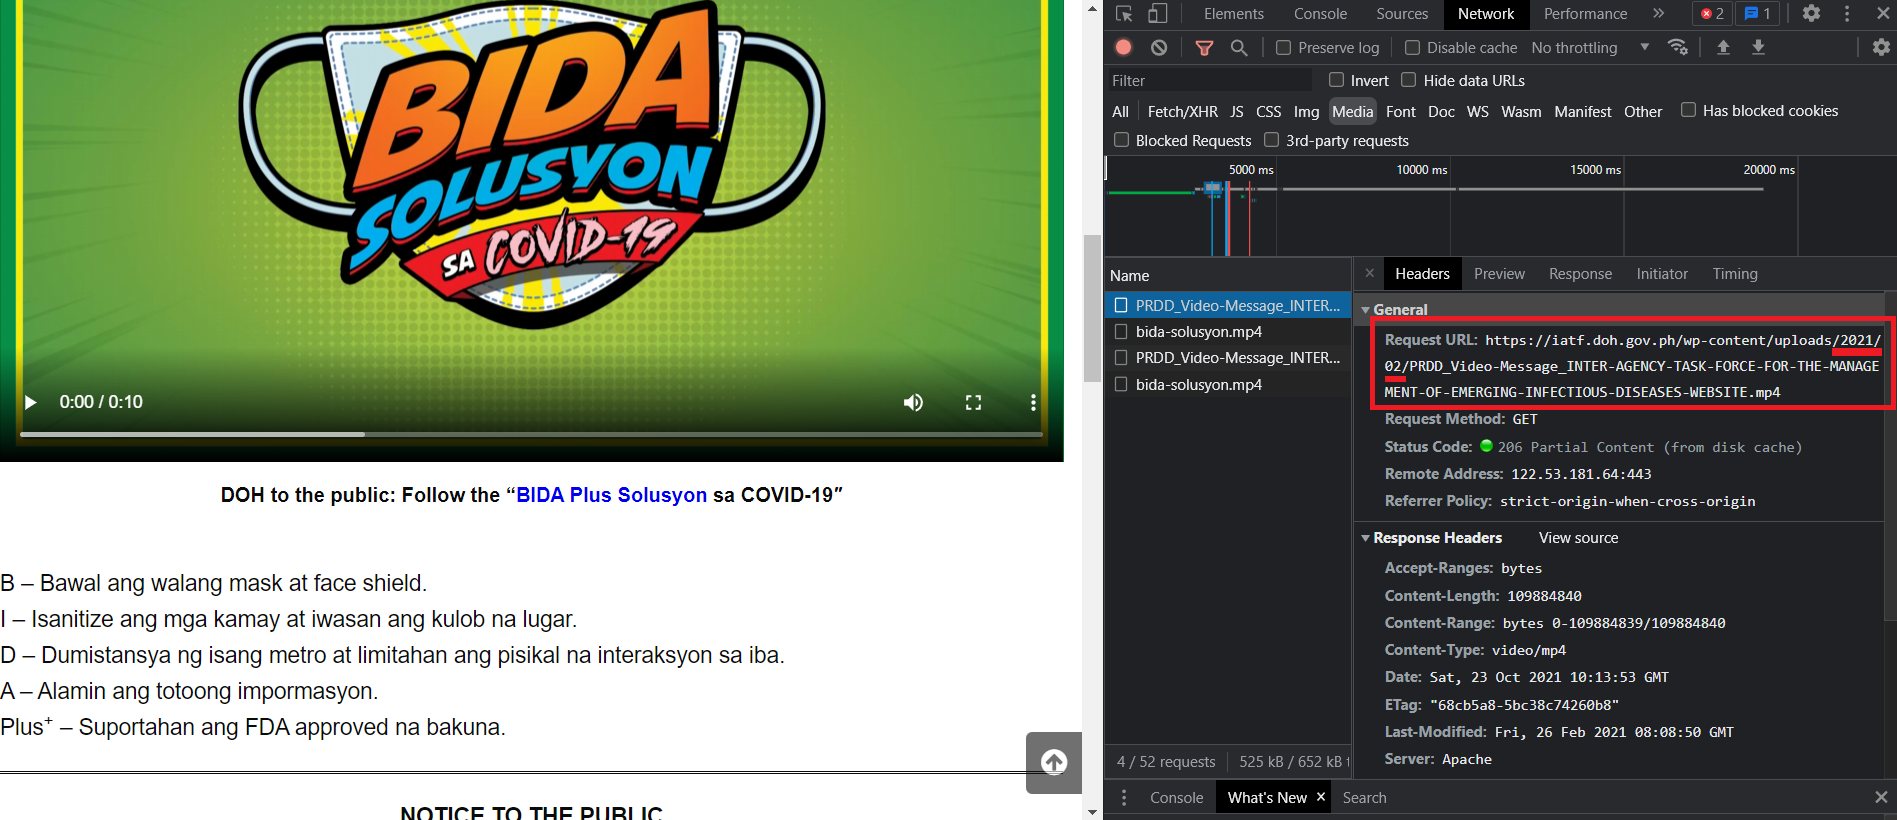
Even the website’s IATF icon was only uploaded on February 2021. See here…

The oldest file that I could find was the Google Form from their Contact Information, which was modified last March 3 2020: https://docs.google.com/forms/d/e/1FAIpQLScYjq3g7ZLP5XUqx9r_OqTdQG_gTOxByZ6WmfB9Y1GMBPzr8g/viewform?embedded=true
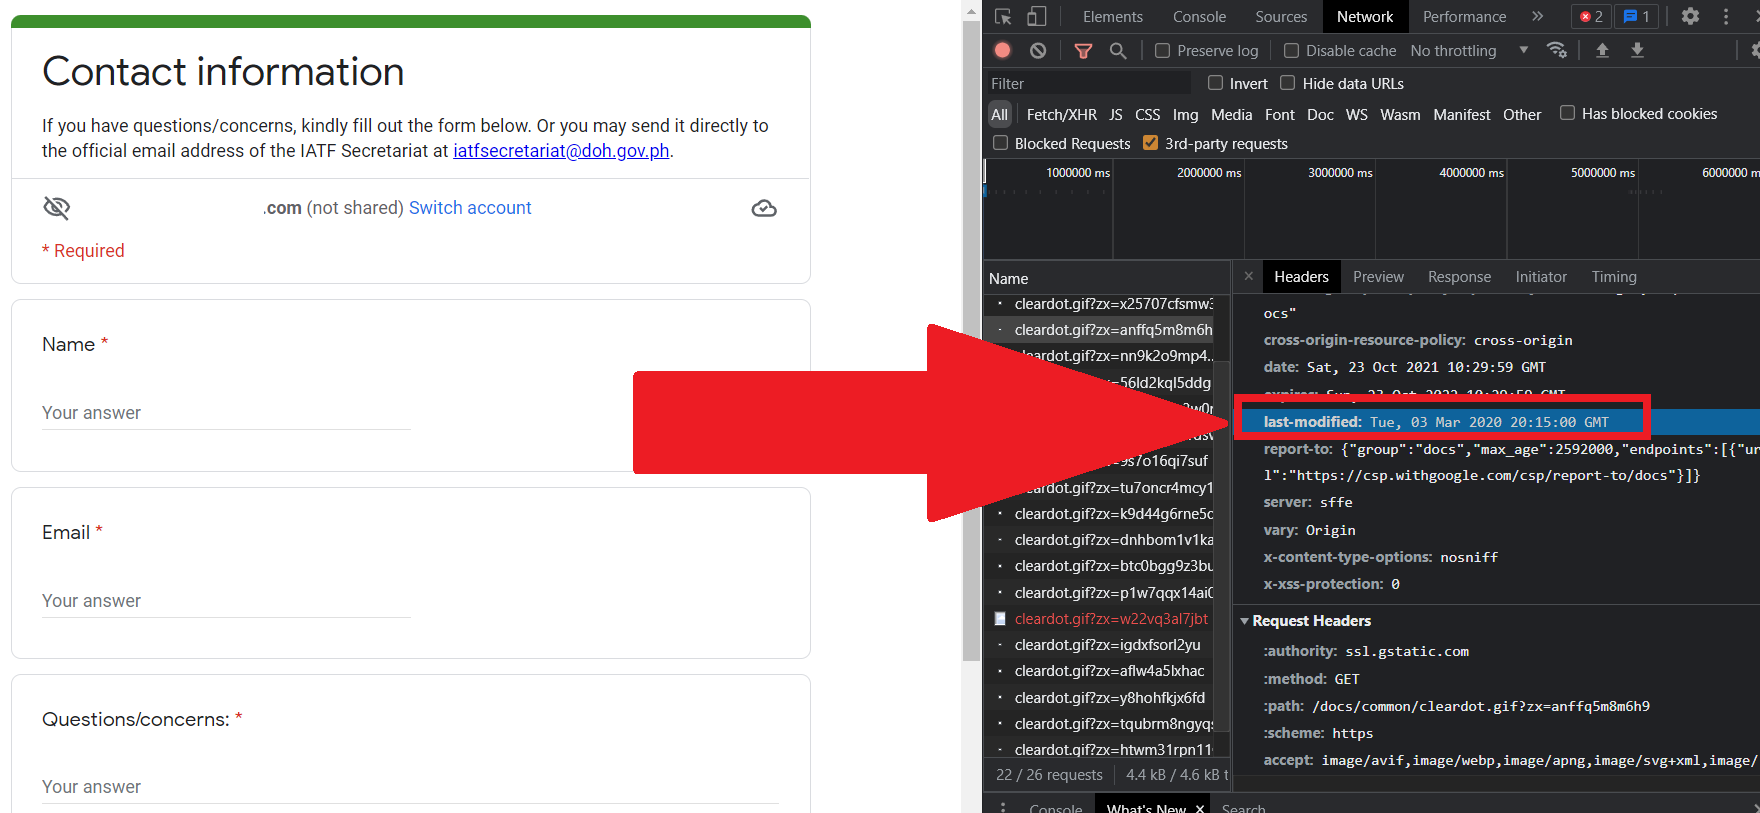
If we base the inception of the website by the same date that the Google Form was modified, it puts the IATF website at 19 months old. With a page visit of 140,492 on October 23, 2021, the average visit per month would be 7,394 or 246 per day.
Finally, when you search Google for “IATF-EID website”, it does not appear on the search engine results page, which would mean that the website is “hidden” and relatively unknown to the general public.
I’d like to point out the importance of this finding: According to the Executive Order No. 168, s. 2014, IATF-EID is supposed to be the organization tasked “to assess, monitor, contain, control and prevent the spread of any potential epidemic in the Philippines.”
This might just be my own personal opinion but, information pertaining to their responses and actions should be easily accessible from an official government channel-specially the one mandated by law to lead the people against pandemics. Having an obscure website does not help, specially now that misinformation is rampant.
The Facebook Page: National Task Force Against Covid19, reads more like a hype machinery for government officials.
To check the quarantine classifications, one had to go through several channels: the DOH website was the first go-to channel, then the alternatives: www.officialgazette.gov.ph, www.facebook.com/HarryRoque and news agencies like newsinfo.inquirer.net. There were quarantine classifications that were not done via resolutions, which added to the complexity.
To spell it out, one had to go out of his or her way to check the official quarantine classification in NCR. The decision could come from IATF, Executive Secretary Medialdea and/or DILG Secretary Año. In one instance, Presidential spokesperson Roque was the source of the quarantine class information.
Here’s the quarantine classification timeline that I created: Google Sheets
In that spreadsheet, I included the IATF resolution number, publish date, detail, date range of the lockdown, source of info and URL.
For the year 2021, here’s a quick summary:
Memo of Exec Sec Medialdea | 01/01/21 | GCQ | January 1 – 31 2021 |
Memo of Exec Sec Medialdea | 01/29/21 | GCQ extension | February 1 – February 28 |
N/A | 02/27/21 | GCQ extension | March 1 – March 31 |
107A | 03/29/21 | ECQ extension | April 1 – April 4 |
108A | 04/04/21 | ECQ extension | April 4 – April 11 |
109A | 04/10/21 | MECQ | April 12 – April 30 |
113A | 04/29/21 | MECQ extension | May 1 – May 14 |
115A | 05/13/21 | GCQ | May 13 – May 31 |
118A | 05/31/21 | GCQ extension | June 1 – June 15 |
121 | 06/14/21 | GCQ extension | June 16 – June 30 |
124 | 06/30/21 | GCQ extension | July 1 – July 15 |
127E | 07/15/21 | GCQ extension | July 16 – July 31 |
130A | 07/29/21 | GCQ extension | August 1 – August 5 |
ECQ | August 6 – August 20 | ||
134 | 08/19/21 | MECQ | August 21 – August 31 |
135A | 08/26/21 | MECQ extension | September 1 – September 7 |
137 | 09/07/21 | MECQ extension | September 7 – September 15 |
N/A | 09/14/21 | Alert Level 4 | September 16 – September 30 |
3 Measuring
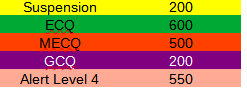
To measure the relationship of the COVID-19 cases and quarantine classifications, if there was any, I first had to assign a numerical value to each quarantine classification. The numerical values would then represent the intensity of the of the classification; low, moderate and high. After having the numerical values, a color was randomly picked to represent it visually.
Here are the results:
Suspension – 200 – Yellow
ECQ – 600 – Green
MECQ – 500 – Brick
GCQ – 200 – Purple
Alert Level 4 – 550 – Light Brick 3
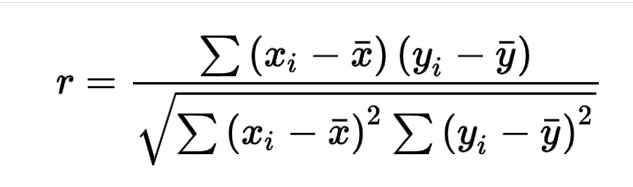
The simplest method that I could think of to measure if there was any relationship between the two variables was by using the Pearson Correlation Coefficient.
This isn’t the best or perfect method. Statisticians and mathematicians would have a better and more precise way to do the analysis.
Initially, I considered Analysis of Variance, since the government mainly used three variations, ECQ-MEQC-GCQ, to mitigate the cases and Simple Regression, using cases as the independent and class as the dependent. A change in the number of cases should impact the intensity of the class, potentially showing a linear relation. But, those two methods did not fit, and so, I defaulted to Pearson’s.
As discussed in my previous article, “The Pearson Correlation Coefficient ranges between 1.0 and -1.0. 1.0 means perfect positive relationship and -1.0 means perfect negative relationship. In a perfect negative relationship, the two variables move in opposite directions.”
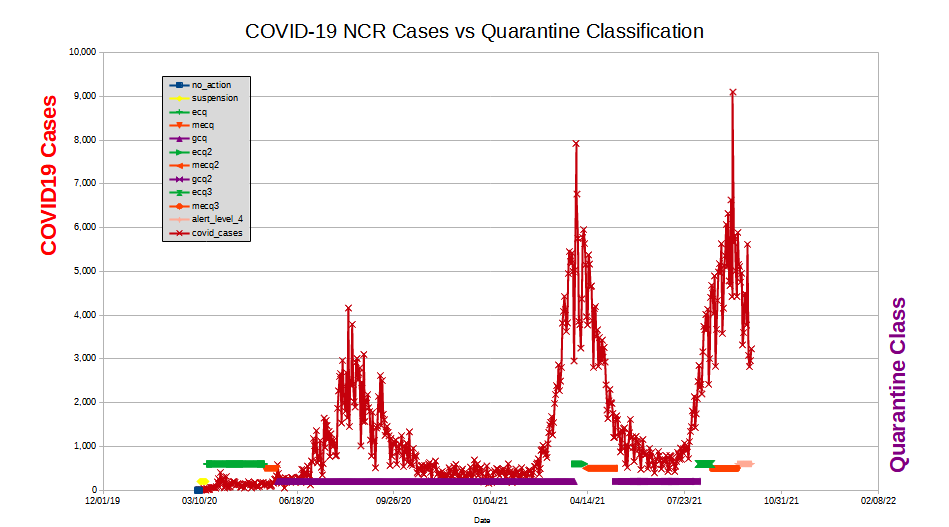
The result:
Cases to classes had a Correlation Coefficient of 0.357720430672712. Statistically, this means there is no correlation between the two. Practically, though, it is more interesting. I’d first like to show you the plot…
4 Interpretation
As mentioned above, a Correlation Coefficient of 0.357720430672712 means no relationship exist between the COVID-19 cases and the quarantine classification.
One interpretation of this measurement would be that, from March 2020 to September 2021, the government’s quarantine decisions, taken as a whole, were not quite aligned with the real life medical situation on the ground. There were periods where the intensity of the quarantine classification was at the lowest, while the cases were high.
A few new clips as the world watched:
The Telegraph, July 11, 2020: Inside the world’s longest and strictest coronavirus lockdown in the Philippines
The Japan Times, Aug 7, 2020: Philippines now has worst COVID-19 outbreak in Southeast Asia
The National News-Asia, Aug 21, 2021: Philippines eases Manila lockdown amid record infections
Aljazeera, Sep 7, 2021: Philippines to relax COVID curbs even as cases hit record levels
But, it cannot be denied that there were also periods where, as intended, the highest-intensity quarantine classification lowered the number of COVID-19 cases.
The Straights Times, May 14, 2021: Philippines to ease Covid-19 curbs in Manila as daily cases decline
CNN Philippines, Aug 2 2021: OCTA: ECQ in Metro Manila effective as COVID-19 surge slows down.
To make this more visually engaging, I grouped the COVID-19 cases and quarantine classifications by quarter, beginning first quarter of 2020 and ending second quarter of 2021.
1st quarter 20 | 2nd quarter 20 | 3rd quarter 20 | 4th quarter 20 | 1st quarter 21 | 2nd quarter 21 | |
COVID19 Cases NCR | 1532 | 17649 | 143810 | 46487 | 115257 | 481160 |
For the quarantine class, it was a bit tricky. Since there were quarters where two to three different types of quarantine classifications were put in place, I had to think of a way to represent them. The simpliest solution that came out was to add up the numerical values to create a new value that would represent the quarter.
Here are the results…

A quick run through of the numbers: Q1 of 2020, the government used Suspension (200) + ECQ (600), giving us the value of 800 as the sum. Q2 of 2020, we have 1300. Q3 of 2020 to Q1 of 2021 we have 200 and finally, Q2 of 2021, we once again have 1300.
Here’s the more easy to digest plot…
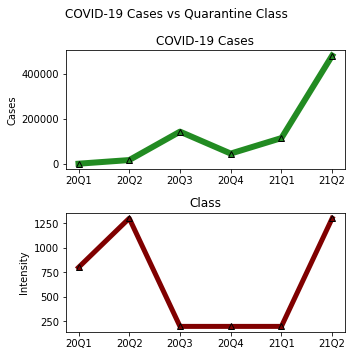
At the top, you have the cases and at the bottom, the intensity. Take your time to take it all in. To let it sink.
Additional news clips as the world watched:
The Straights Times, Aug 1 2020: Doctors and nurses in the Philippines urge government to put Manila back on coronavirus lockdown
Philippine Daily Inquirer, Aug 11, 2020: No more funds; let Filipinos return to work – Duterte to doctors seeking longer lockdown
Reuters, Apr 11, 2021: Philippines to ease some tough COVID-19 restrictions from Monday
ABS-CBN News, Apr 13, 2021: ECQ should have been extended for 2 more weeks: health professionals
5 Damage
Now that the situation with the COVID-19 cases and quarantine classifications have been laid out, we can proceed to the measurement of the damages done in real estate.
The Philippines does not have a central agency that focuses on tracking real estate transactions. The nearest institutions that would resemble that would be the Bureau of Internal Revenue (our taxman) and the Bangko Sentral ng Pilipinas (our central bankers). Bangko Sentral publishes the Residential Real Estate Price Index where they track the residential loans provided by local banks on a quarterly basis but, they do not include the actual sales figures behind the index.
Our only source for this part of the work is the Philippine Stock Exchange. All the publicly traded real estate developers are required to submit their quarterly and annual financial statements, and that’s where we’ll get our numbers.
6 Real Estate Revenues
Real estate revenue of the developers is one of the best indicators of the health of the real estate market, for the simple reason that the bulk of the properties being sold and leased comes from them and their numbers are easily accessible and understandable.
To easily extract the numbers that were needed, I used PSE’s Edge report viewer. In some cases where I felt I needed to double check, I downloaded the PDF file and manually browsed through the financial information.
Excluding the REITs, here are the quarterly revenues from the 1st quarter of 2020 to the 2nd quarter of 2021 of the thirty-five (35) publicly traded real estate companies in the Philippines.
| No. | Company | 1st quarter 20 | 2nd quarter 20 | 3rd quarter 20 | 4th quarter 20 | 1st quarter 21 | 2nd quarter 21 |
| 1 | 8990 Holdings, Inc. | 3,465 | 1,443 | 4,828 | 4,496 | 4,476 | 5,535 |
| 2 | A Brown Company, Inc. | 302 | 233 | 304 | 24 | 216 | 83 |
| 3 | Anchor Land Holdings, Inc. | 1,025 | 647 | 1,314 | 911 | 997 | 1,189 |
| 4 | Araneta Properties, Inc. | 23 | 0 | 0 | -3 | 14 | 4 |
| 5 | Arthaland Corporation | 577 | 308 | 577 | 1,838 | 448 | 796 |
| 6 | Ayala Land, Inc. | 28,402 | 12,796 | 22,121 | 32,951 | 24,638 | 24,317 |
| 7 | Belle Corporation | 1,421 | 586 | 905 | 1,260 | 1,296 | 1,240 |
| 8 | Cebu Holdings, Incorporated | 1,309 | 364 | 455 | 803 | 456 | 438 |
| 9 | Cebu Landmasters, Inc. | 2,122 | 1,418 | 2,214 | 2,612 | 2,371 | 2,820 |
| 10 | Century Properties Group, Inc. | 2,802 | 1,717 | 3,761 | 2,553 | 2,078 | 2,351 |
| 11 | City & Land Developers, Incorporated | 98 | 40 | 92 | 123 | 150 | 98 |
| 12 | Cityland Development Corporation | 477 | 218 | 484 | 525 | 549 | 416 |
| 13 | Crown Equities, Inc. | 58 | 24 | 47 | 74 | 55 | 50 |
| 14 | Cyber Bay Corporation | 0 | 0 | 0 | 1 | 0 | 0 |
| 15 | D.M. Wenceslao & Associates, Incorporated | 1,102 | 535 | 663 | 571 | 739 | 562 |
| 16 | DoubleDragon Properties Corp. | 1,914 | 6,193 | 1,685 | 4,468 | 1,517 | 1,171 |
| 17 | Empire East Land Holdings, Inc. | 1,353 | 1,021 | 863 | 1,531 | 1,093 | 843 |
| 18 | Filinvest Land, Inc. | 4,878 | 3,099 | 3,608 | 4,636 | 4,355 | 3,742 |
| 19 | Global-Estate Resorts, Inc. | 1,527 | 1,386 | 943 | 1,338 | 1,201 | 1,229 |
| 20 | Keppel Philippines Properties, Inc. | -5 | -63 | -14 | -50 | 18 | 4 |
| 21 | MRC Allied, Inc. | 0.154 | 0.000 | 0.559 | 0.889 | 0.336 | 0.653 |
| 22 | Megaworld Corporation | 14,394 | 8,055 | 8,364 | 8,458 | 9,329 | 11,229 |
| 23 | PTFC Redevelopment Corporation | 51 | 48 | 48 | 52 | 48 | 48 |
| 24 | Philippine Estates Corporation | 14 | 9 | 18 | 31 | 19 | 18 |
| 25 | Philippine Infradev Holdings, Inc. | 12 | 2 | 17 | 96 | 1 | 7,961 |
| 26 | Philippine Realty and Holdings Corporation | 192 | 78 | 50 | 60 | 82 | 100 |
| 27 | Primex Corporation | 485 | 3 | 151 | -31 | 18 | 10 |
| 28 | Robinsons Land Corporation | 11,571 | 3,856 | 4,575 | 5,400 | 16,666 | 9,301 |
| 29 | Rockwell Land Corporation | 3,217 | 924 | 2,645 | -3950 | 3,161 | 3,429 |
| 30 | SM Prime Holdings, Inc. | 26,195 | 18,213 | 17,261 | 20,227 | 21,039 | 20,227 |
| 31 | Shang Properties, Inc. | 2,044 | 901 | 2,005 | 1,268 | 1,177 | 1,022 |
| 32 | Sta. Lucia Land, Inc. | 1,490 | 937 | 2,107 | 2,316 | 2,289 | 1,664 |
| 33 | Suntrust Home Developers, Inc. | 0 | 0 | 0 | 0 | 0 | 0 |
| 34 | Vista Land & Lifescapes, Inc. | 9,930 | 7,687 | 7,355 | 6,284 | 9,202 | 7,673 |
| 35 | Vistamalls, Inc. | 2,094 | 1,325 | 1,313 | 2,541 | 2,022 | 1,732 |
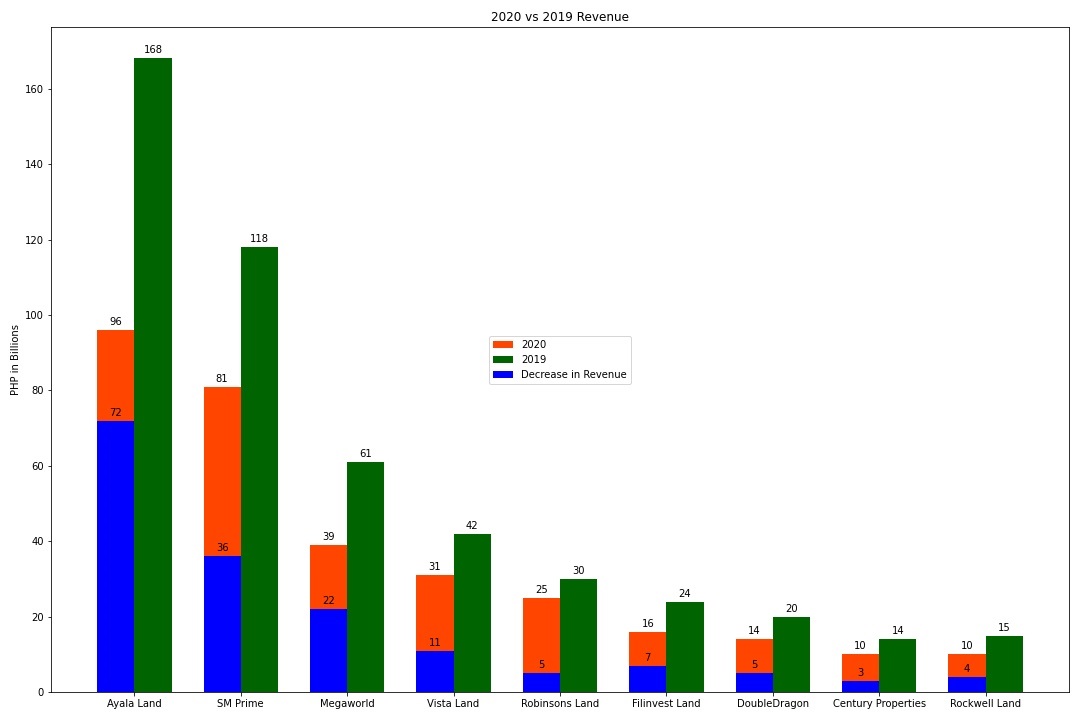
From here, we can concentrate only on the developers with major projects in NCR and have Billions of Pesos in revenues.
Here are the top nine (9) developers and their 2019 and 2020 annual revenues. The decline will show the magnitude of the harm done by the pandemic.
Developer | 2019 | 2020 | Decrease in Revenue | % Decrease |
Ayala Land, Inc. | 168793712000 | 96272699000 | 72,521,013,000 | -42.96 |
SM Prime Holdings, Inc. | 118311490000 | 81899298000 | 36,412,192,000 | -30.78 |
Megaworld Corporation | 61961845926 | 39273468557 | 22,688,377,369 | -36.62 |
Vista Land & Lifescapes, Inc. | 42897270265 | 31256080944 | 11,641,189,321 | -27.14 |
Robinsons Land Corporation | 30583835565 | 25404826534 | 5,179,009,031 | -16.93 |
Filinvest Land, Inc. | 24021862000 | 16223341000 | 7,798,521,000 | -32.46 |
DoubleDragon Properties Corp. | 20203714946 | 14262471598 | 5,941,243,348 | -29.41 |
Century Properties Group, Inc. | 14315016268 | 10835744692 | 3,479,271,576 | -24.31 |
Rockwell Land Corporation | 15709466000 | 10737336000 | 4,972,130,000 | -31.65 |
Plotting it will help us visually…
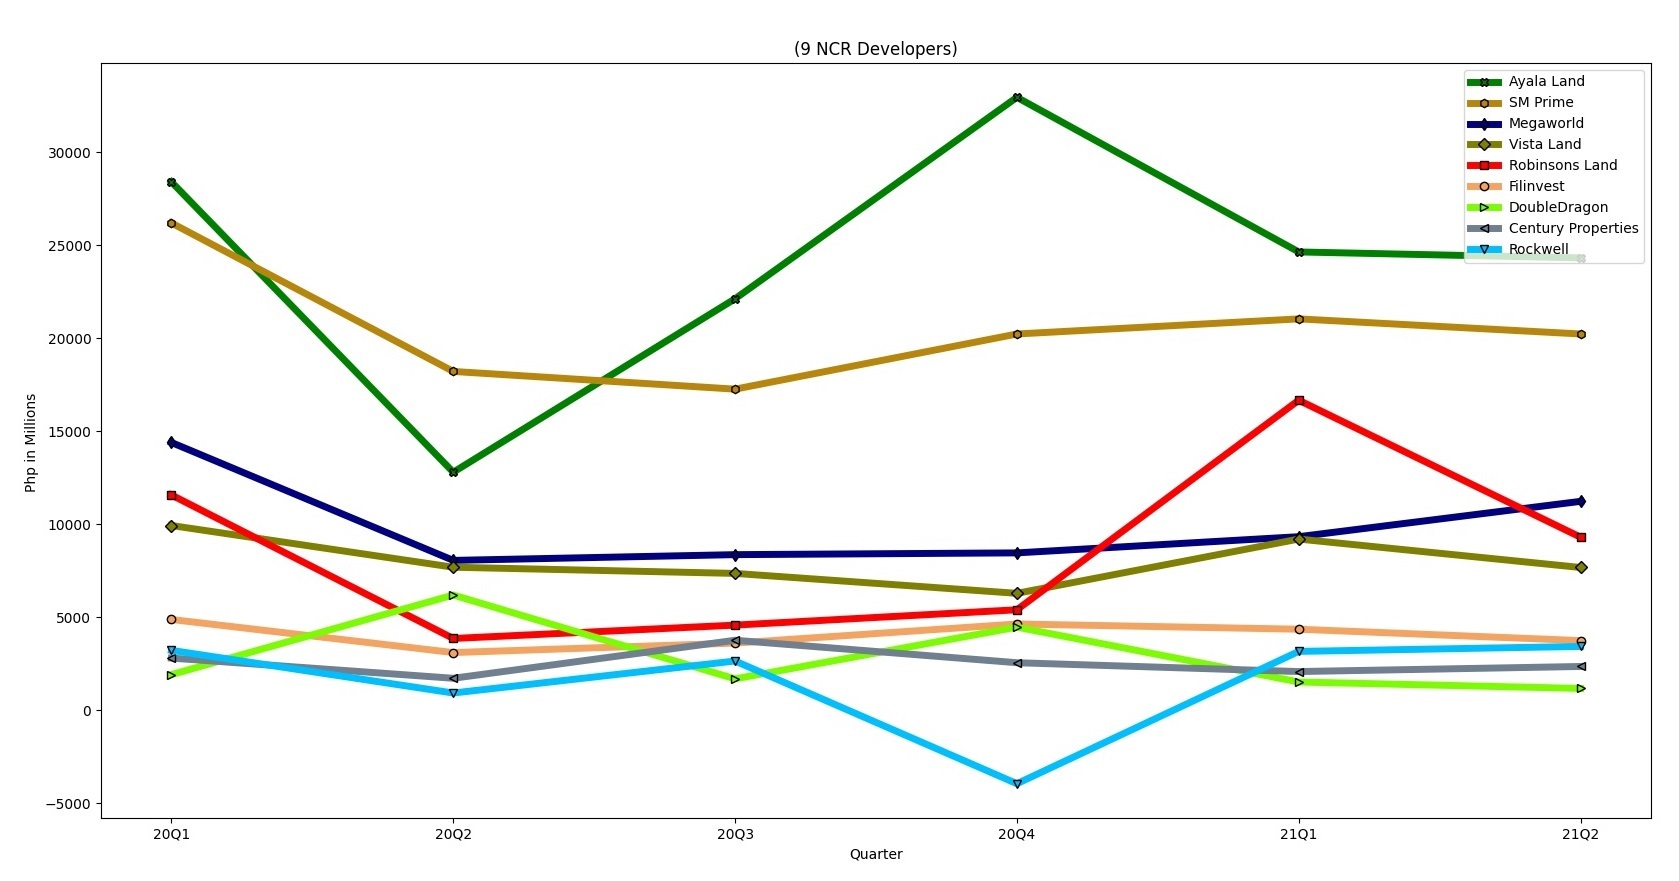
Breaking it down per quarter…
| No | Developers | 1st quarter 20 | 2nd quarter 20 | 3rd quarter 20 | 4th quarter 20 | Full Year 2020 | 1st quarter 21 | 2nd quarter 21 |
| 1 | Ayala Land, Inc. | 28402 | 12796 | 22121 | 32951 | 96,272 | 24638 | 24317 |
| 2 | SM Prime Holdings, Inc. | 26195 | 18213 | 17261 | 20227 | 81,899 | 21039 | 20227 |
| 3 | Megaworld Corporation | 14394 | 8055 | 8364 | 8458 | 39,273 | 9329 | 11229 |
| 4 | Vista Land & Lifescapes, Inc. | 9930 | 7687 | 7355 | 6284 | 31,256 | 9202 | 7673 |
| 5 | Robinsons Land Corporation | 11571 | 3856 | 4575 | 5400 | 25,404 | 16666 | 9301 |
| 6 | Filinvest Land, Inc. | 4878 | 3099 | 3608 | 4636 | 16,223 | 4355 | 3742 |
| 7 | DoubleDragon Properties Corp. | 1914 | 6193 | 1685 | 4468 | 14,262 | 1517 | 1171 |
| 8 | Century Properties Group, Inc. | 2802 | 1717 | 3761 | 2553 | 10,835 | 2078 | 2351 |
| 9 | Rockwell Land Corporation | 3217 | 924 | 2645 | -3950 | 10,737 | 3161 | 3429 |
Line plot…
Stacking the revenues and quarantine cases…
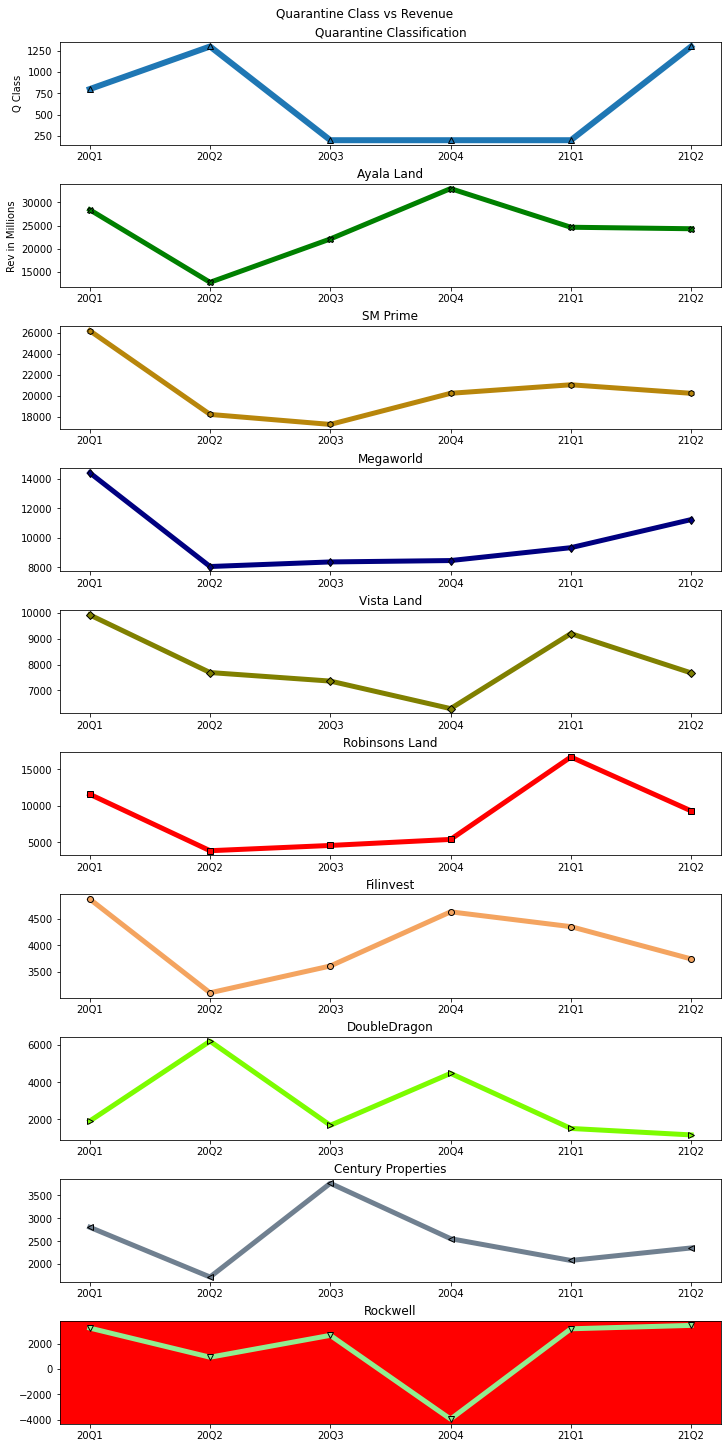
I highlighted Rockwell Land since it sustained the most significant decline in revenue among the group, to the tune of ₱3,950,869,000 in the 4th quarter of 2020.
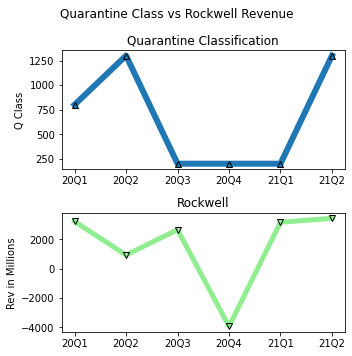
Rockwell attributes the decline to low project accomplishments and sales bookings from the impact of the pandemic and quarantine restrictions and the lease concessions it gave to its retail tenants.
The story is mostly the same across the board. I have included some excerpts from the developers 2020 annual reports below.
7 Real Estate Stock Prices
Just for fun, here are the available stock prices of each developer at the end of each quarter.
| No | Developer | 1st quarter 20 | 2nd quarter 20 | 3rd quarter 20 | 4th quarter 20 | 1st quarter 21 | 2nd quarter 21 |
1 | Ayala | 30.2000 | 33.8000 | 29.7000 | 40.9000 | 34.3500 | 36.0500 |
2 | SM Prime | 27.3500 | 31.8500 | 29.4000 | 38.5000 | 35.0000 | 36.5000 |
3 | Megaworld | 2.5000 | 3.0500 | 2.9600 | 4.0800 | 3.5800 | 3.2300 |
4 | Vista Land | 4.0800 | 3.6900 | 3.4100 | 4.6800 | 3.7400 | 3.8000 |
5 | Robinsons Land | 14.8400 | 17.4800 | 14.2000 | 21.2000 | 17.9600 | 17.2800 |
6 | Filinvest Land | 0.9100 | 0.9900 | 0.9100 | 1.1200 | 1.1000 | 1.1000 |
7 | DoubleDragon | 16.1600 | 17.1200 | 14.0000 | 14.9000 | 13.2000 | 12.1000 |
8 | Century Properties | 0.3700 | 0.3700 | 0.3600 | 0.4500 | 0.3800 | 0.5700 |
9 | Rockwell | 1.4800 | 1.6000 | 1.3700 | 1.5400 | 1.5700 | 1.5300 |
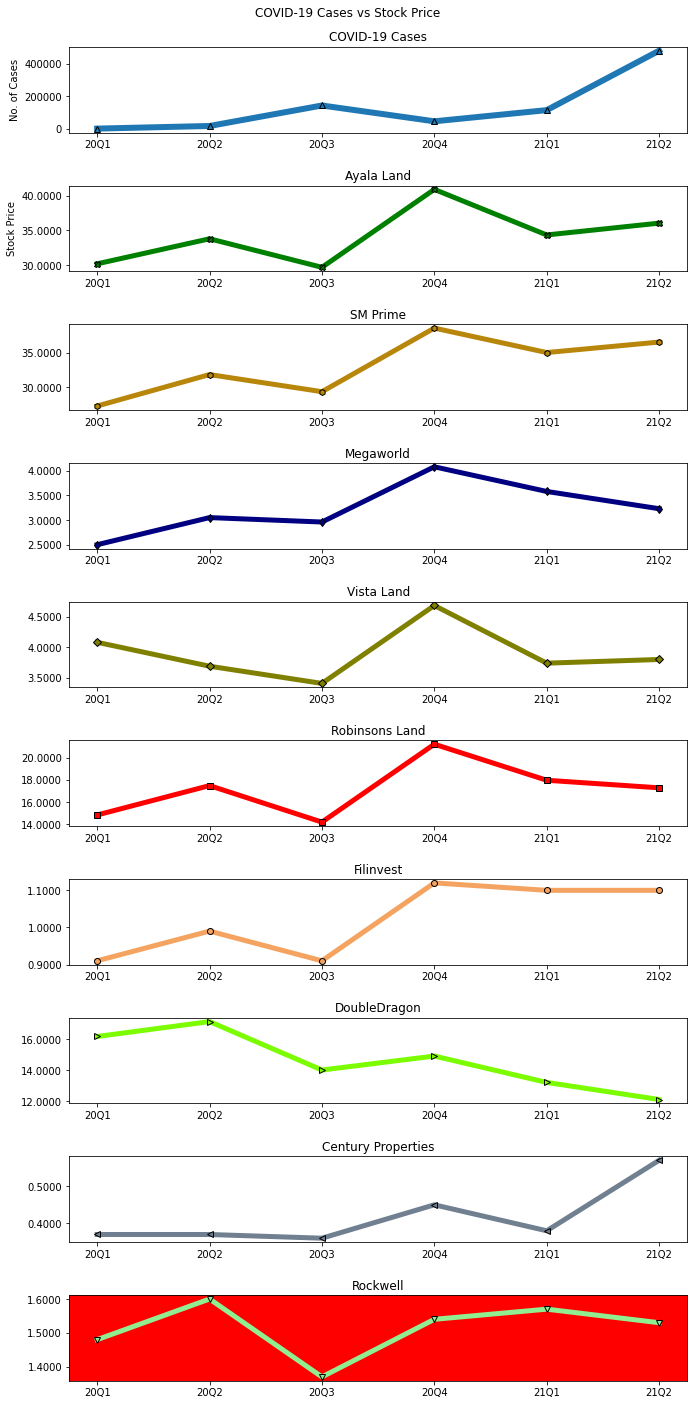
Stacking these share prices against the COVID-19 cases…
And finally, putting it side by side with the revenue and quarantine classifications…
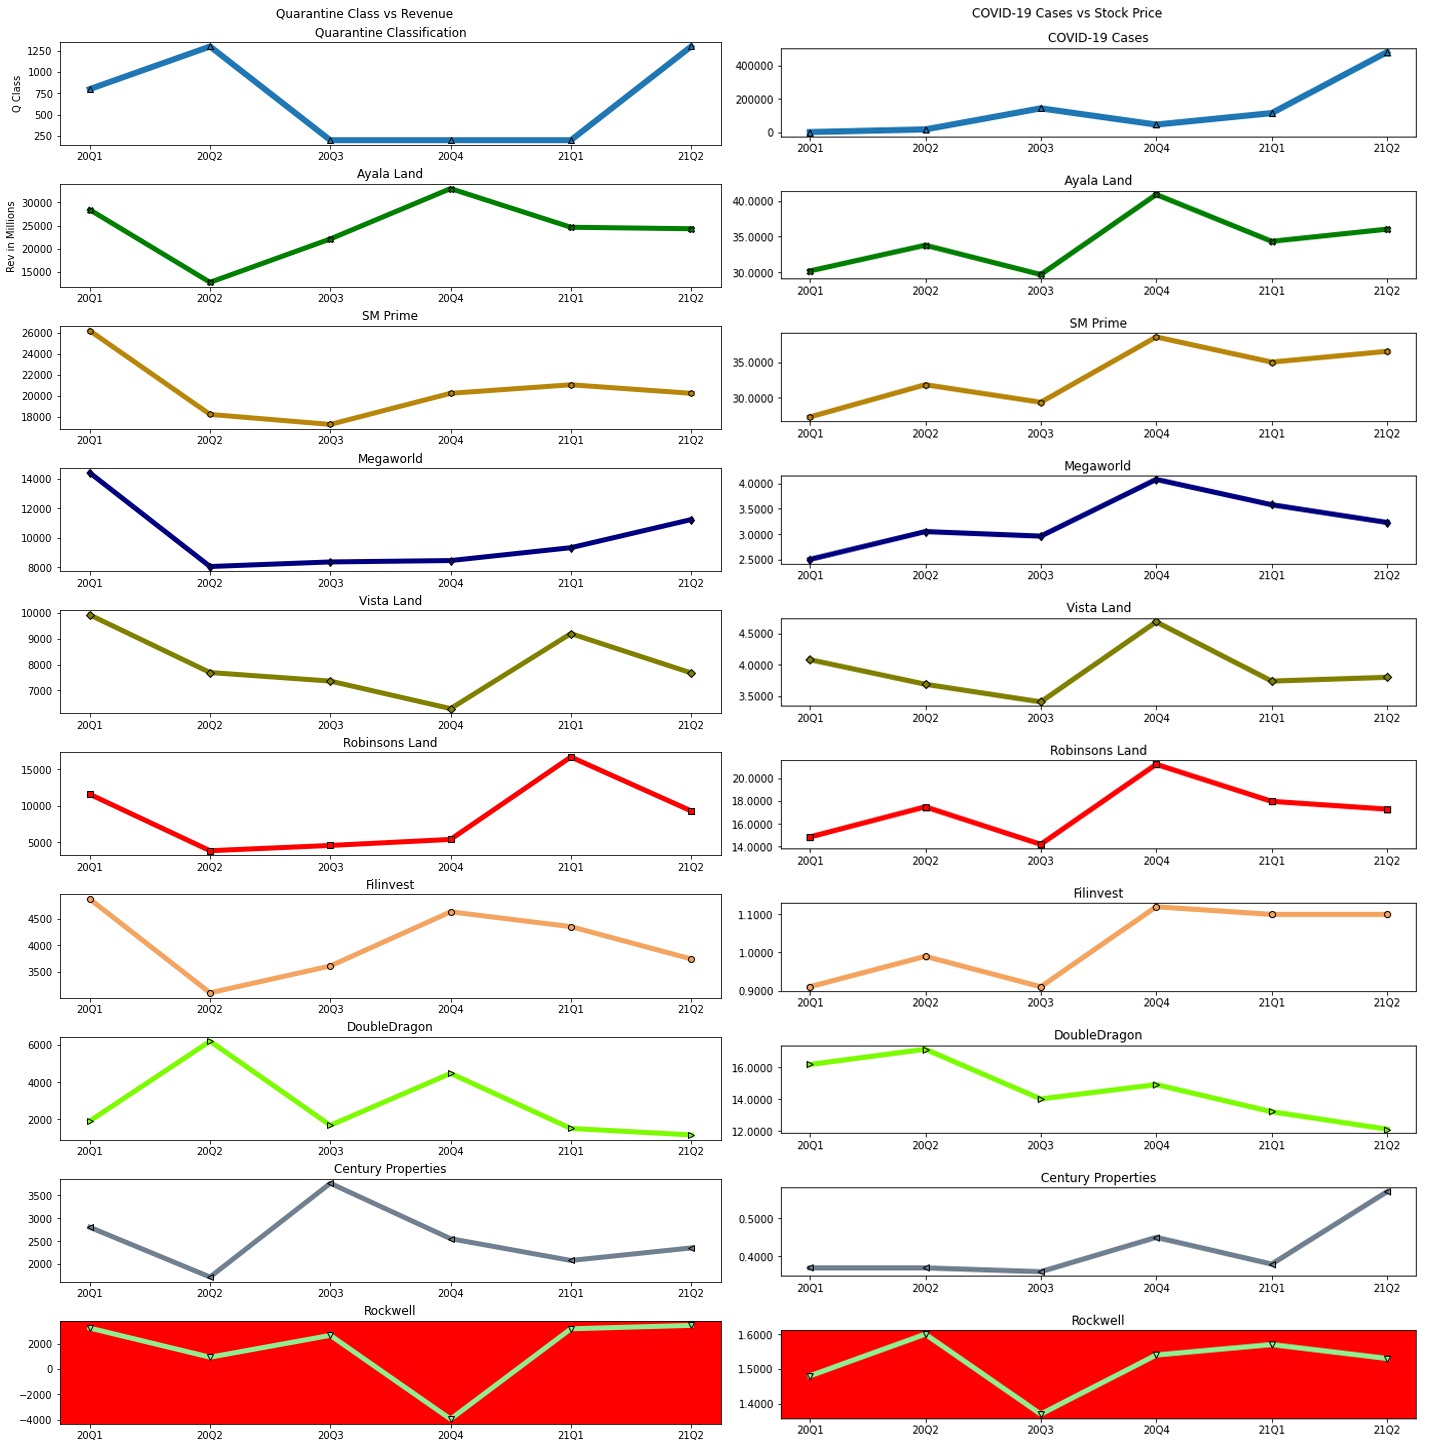
Trading equities is not in my circle of competence so, it’s hard for me to comment on their movements. But, one thing to note about the share prices above is that the quarterly and annual reports were published on the PSE’s Edge website one to three months after the actual quarter or year has ended. This lag in reporting may have caused a delay in the pricing sentiments of the retail traders, so a rise or fall in the quarterly revenue reports as shown in the left plot may not necessarily translate to the rise and fall of the share price in the other plot. There are a lot of other varying factors at play when it comes to share price movements so don’t take the graphs too seriously.
9 Effects In Real Life
The numbers that appeared on your screen have real life consequences. There are winners and losers in this pandemic; investors looking to acquire properties at fire sale prices are winners and the families who will have their homes foreclosed are the losers.
Not to sound disrespectful to the fallen, but you could also say that the importers and wholesalers of face-shields are among the big winners, while those that did not make it through, are part of the losing team.
Every percentage decline in the developer’s revenue has a cascading effect to our society:
On the national level, the decline in revenue means a decline in the taxes collected by the government. As much as we hate taxes, it helps lubricate the cogs of our economy.
On the local level, the decrease in revenue means a loss in the livelihood of contractors, sub-contractors and all the other third-parties that revolve around the developers:
Construction firms may have laid off or put on-hold the payments for laborers since constructions activities were halted. The small stores that cater to the laborers would have had no choice but to also stop or cut down their operations since there were no customers.
Landscaping contractors may have stopped ordering plants from local gardeners, specially those living in communities that are dependent on the sales of these products, like the many baranggays in Silang, Cavite. This loss in order flow may then have a negative effect on the mom and pop suppliers of fertilizers and equipment.
9.1 Brokers, Agents, Landlords, Tenants, Buyers And Sellers, As Market Participants
For brokers and agents, the downturn in the market directly results in the downturn of their livelihood. Majority of these are professionals who are working solely on a commission basis, so no market activity means no money.
For tenants, the rates are currently suppressed so they have the opportunity to enjoy low monthly obligations, but the moment the market recovers and gets back in equilibrium with price inflation, there’s a possibility that their renewal rate will jump significantly high to catch up with the real prices and the new tenants by that time will be potentially squeezed out of every peso.
For landlords, the suppression in rental prices have a direct impact on their wallets. It will be even more distressing if their units will remain vacant. The association dues, property taxes, pest control and maintenance expenses will continue to be charged regardless if prices remain low or if the units are untenanted.
For buyers, there are those who will potentially enjoy the windfall of fire sale prices.
10 Conclusion
From the data that we have analyzed we can extrapolate that the damage done to the market is far from over. The severity of the damage might lessen due to the gradual lifting of the restrictions but the financial and medical suffering will potentially continue.
As the pandemic progresses, the more we see that the policies put in place to curb the infections are anchored on the political behavior and personal idiosyncrasies of the people in charge, instead of science.
Case in point:
Interaksyon, Oct 25, 2021: Crowding at Manila dolomite beach draws calls to open more public spaces
“The Manila Police District shared that some 65,000 people in total went to the area on Sunday alone.”
And to solve the problem:
PhilStar, Oct 27, 2021: Ex-general to oversee dolomite beach after crowding causes uproar
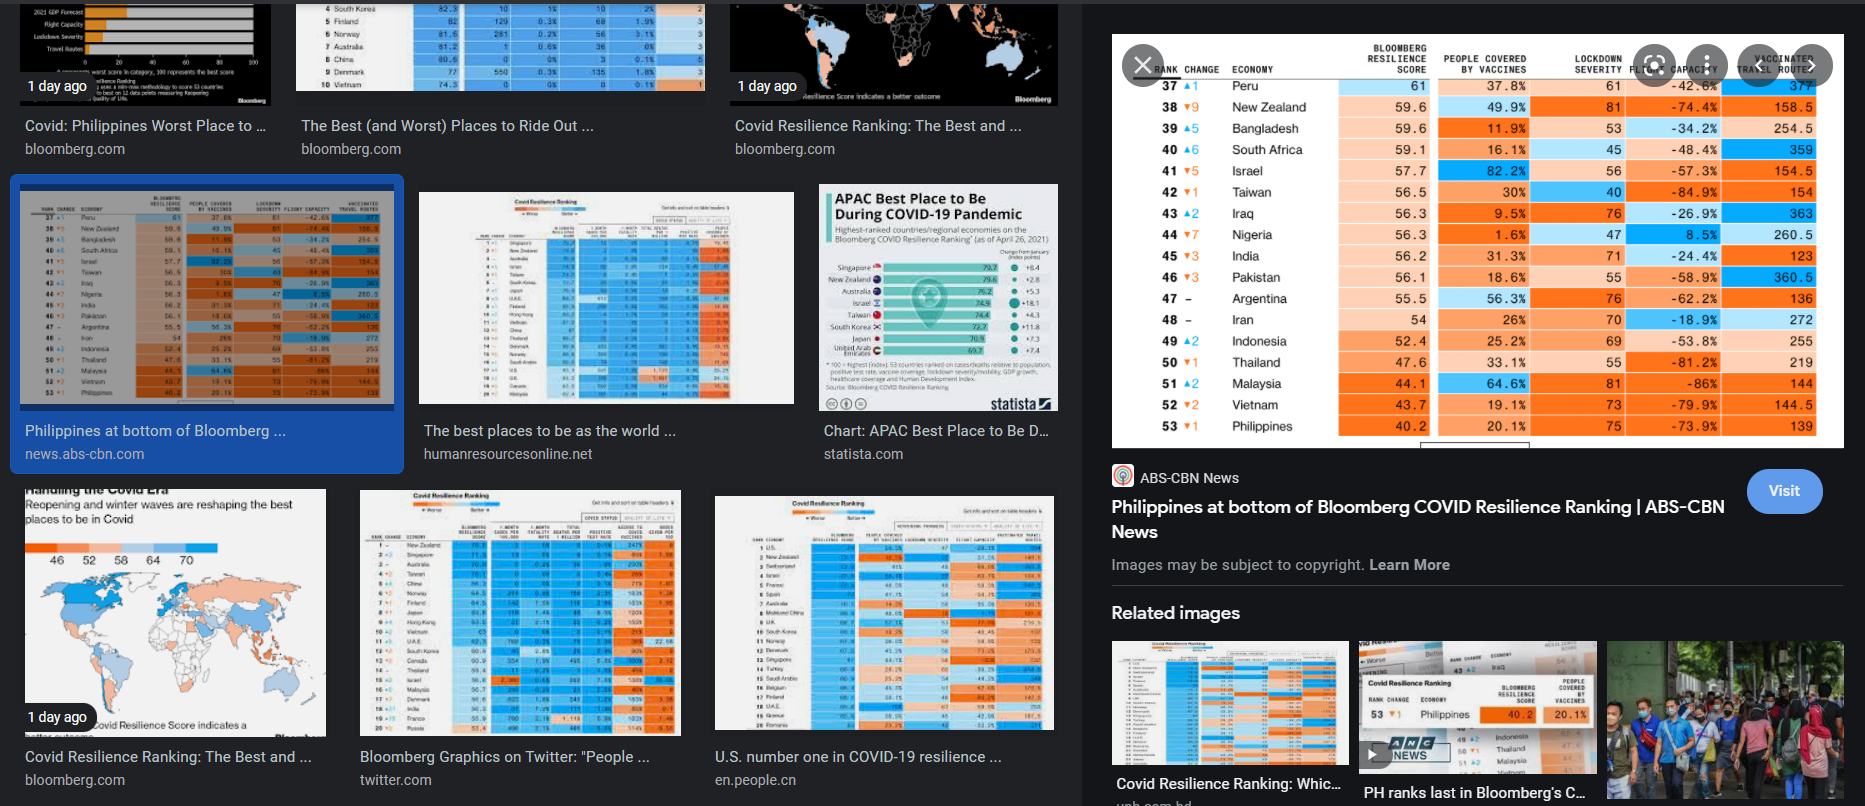
The quick calculation that we’ve done to see if there is any relationship between the COVID-19 cases and the quarantine classifications imposed by the authorities showed no correlation. As a real life consequence, our country ranks worst in the entire world.
The Straits Times, Sep 29, 2021: The Philippines fell to last place in Covid-19 ranking of best and worst places to be in pandemic
The Manila Times, Sep 30, 2021: ‘PH worst place to live amid pandemic’
Philippine Daily Inquirer, Oct 27, 2021: PH still at bottom of COVID-19 economic resilience ranking
Bloomberg (paywalled), Oct 28, 2021: Covid: Philippines Worst Place to Be With Low Vaccinations, Movement Curbs
ABS-CBN News, Oct 28, 2021: PH bottom again in COVID resilience ranking, but has ‘better handle’ of pandemic now
Philippine Star, Oct 28, 2021: Philippines remains at bottom of Bloomberg’s COVID-19 resilience ranking
MSM/BusinessWorld, October 28, 2021: Philippines remains worst place to be amid pandemic
The beatings will continue until morale improves.
Further Reading. Excerpts From The 2020 Annual Reports
1 Ayala Land – Review of FY 2020 operations vs FY 2019
Ayala Land endured the severe impact of COVID-19 in 2020 recording a 43% decline in consolidated revenues to P96.27 billion from P168.79 billion and a 74% drop in net income to P8.73 billion from P33.19 billion. Key indicators improved steadily from the third quarter to the fourth quarter reflecting a 49% growth in total revenues to P32.95 billion and a 28% jump in net income to P2.36 billion, sustaining the momentum for recovery.
Real Estate revenues, composed of Property Development, Commercial Leasing, and Services registered at P85.97 billion, a 46% decline from P157.85 billion due to construction restrictions, lower bookings, and restrained mall and hotel operations. PDF Page 26.
Accounting for Lease Concessions
In line with the rental relief framework implemented by the government to support businesses and the broader economy due to the impact of Covid-19, the Group waived its right to collect rent and other charges as part of various lease concessions it granted to lessees such as lease payment holidays or lease payment reductions. PDF Page 124.
The Group assessed that the lease concessions it granted to lessees do not qualify as lease modifications since the terms and conditions under the corresponding lease contracts have not been modified by the waiver. The Group accounted for the lease concessions in the form of negative variable rent which the Group recorded when the concession is granted regardless of the period to which the concession pertains. The Group’s
accounting for lease concession under PFRS 16 is significant to our audit because there were numerous lease concessions granted to lessees during the period; the recorded amounts are material to the consolidated financial statements; and accounting for lease concession involves the application of significant judgment in determining whether or not the lease concession is a lease modification. PDF Page 124.
2 SM Prime – Rent
SM Prime recorded consolidated revenues from rent of P32.01 billion in 2020, a decrease of 48% from P61.76 billion in 2019. The decrease in rental revenue was due to the temporary closure of malls as well as other businesses not deemed essential to daily life during the implementation of the community quarantine. PDF Page 36.
SM Prime waived a total of P23.30 billion in rentals and other charges throughout the government-imposed community quarantine. Out of the total rental revenues, 82% is contributed by the malls and the rest from offices and hotels and convention centers. PDF Page 36.
Real Estate Sales
SM Prime recorded 6% increase in real estate sales in 2020 from P44.47 billion to P46.97 billion primarily due to sales take-up and construction accomplishments during the period of ongoing projects including Shore 3, Bloom, Vine, Fame and Lane and fast take-up of various Ready-For-Occupancy(RFO) projects particularly those located in Mandaluyong and Pasay. Even with the imposition of the community quarantine, SM Residences was immediately able to adjust its market reach by maximizing various digital sales platforms and offering flexible payment terms to buyers. Actual construction of projects usually starts within twelve to eighteen months from launch date and revenues are recognized in the books based on percentage of completion. PDF Page 36.
Accounting for Lease Concession
In 2020, the Company granted various lease concessions such as lease payment holidays or lease payment reduction to the lessees of its commercial spaces as a response to the laws and regulations issued by the government mandating the granting of certain lease concession during the coronavirus pandemic. PDF Page 79.
3 Megaworld – Review of December 31, 2020 versus December 31, 2019
Megaworld, the country’s largest developer of integrated urban townships, saw its net income decline by 45.13% to Php10.59 billion in 2020 from Php19.30 billion last year.
The Group’s weaker earnings was traced mainly due to COVID-19 pandemic affecting the core businesses. Net income attributable to parent company stood at Php9.89 billion, lower by 44.87% from Php17.93 billion last year.
Megaworld’s consolidated revenues decreased by 35.42% from Php67.31 billion in 2019 to Php43.47 billion
in 2020. PDF Page 29.
Statements of Income
41.65% decrease in sales
Mainly due to lower sales bookings resulting from temporary suspension of project construction activities during enhanced community quarantine period (ECQ)
23.08% decrease in rental income
Decrease in rental was due to lower revenue from mall rentals because of slowdown in foot traffic resulting from pandemic related concerns
41.73% decrease in hotel operations
Due to lower check-ins of hotels due to government implementation of travel restrictions and pandemic related concerns. PDF Page 31
Impact of COVID-19 Pandemic on the Group’s Business The COVID-19 pandemic started to become widespread in the Philippines in early March 2020. The measures taken by the government to contain the virus have affected economic conditions and the Group’s business operations.
The following are the impact of the COVID-19 pandemic to the Group’s businesses:
Real Estate Sales
Real estate sales ended 42% lower due to fewer reservations, limited selling activities and restricted construction activities. Other observations are presented below.
Lease of Office and Commercial Spaces
Rental income dropped by 23% primarily due to temporary closure of mall and commercial spaces, rent concessions and lower foot traffic upon reopening. Concession of rent and other related charges amounted to P2.2 billion.
Hotel Operations
Hotel revenues shrank by 42% as a result of temporary closure of hotels, travel bans and limited hotel operations in accordance with quarantine limitations. PDF Page 81.
4 Vista Land – REVIEW OF YEAR END 2020 VS YEAR END 2019
RESULTS OF OPERATIONS
Revenues
Real Estate
The Company recorded revenue from real estate sales amounting to P21,800.6 million for the year ended December 31, 2020, a decrease of 34% from P32,827.9 million in same period last year. This was primarily attributable to the decrease in the overall completion rate of sold inventories of its business units as a result of the enhanced community quarantine (“ECQ”) implemented on March 16,2020 that prohibited construction activities. The Company uses the Percentage of completion method of revenue recognition where revenue is recognized in reference to the stages of development of the properties. PDF Page 34.
Rental income
Rental income decreased by 7% from P=7,748.4 million for the year ended December 31, 2019 to P7,196.7 million for the year ended December 31, 2020. The decrease was primarily attributable to the mall closures during lockdown starting March 16, 2020 but was offset by the tenant mix of the malls being majority essential thus they were allowed to operate as soon as the lockdown were gradually lifted. In addition, the group provided concession to tenants on a case by case rather than an across the board concessions. PDF Page 35.
5 Robinsons Land – Year ended December 31, 2020 versus same period in 2019
RLC generated total gross revenues of P25.40 billion for calendar year 2020, a decrease of 16.9% from P30.58 billion the previous year. EBIT and EBITDA declined by 30.9% to P8.49 billion and 20.7% to P13.68 billion, respectively. Meanwhile, net income ended at P=5.26 billion, 39.5% lower compared to calendary year 2019.
The Commercial Centers Division accounted for 23% of total company
revenues to close at P5.96 billion in 2020, 55.0% lower versus previous year. Rental concessions were provided to support the recovery of partner tenants affected by temporary mall closures and quarantine restrictions. PDF Page 57.
6 Filinvest Land – Results of Operations for 2020
Year ended December 31, 2020 compared to year ended December 31, 2019
For the year ended December 31, 2020, FLI’s net income registered a year on year decline of 39.30% or P2,562.05 million from ₱6,519.80 million in 2019 to ₱3,957.75 million in 2020.
Revenues and other income
Total consolidated revenues went down by ₱7,798.52 million or 32.46%, from ₱24,021.86 million in 2019 to ₱16,223.34 million in 2020 due to lower revenues generated from both business segments of real estate sales and rental and related services.
Real estate sales decreased by ₱7,176.00 million or by 42.18%, from ₱17,013.12 million in 2019 to ₱9,837.12 million in 2020.
Rental and related services decreased by ₱622.52 million or by 8.88%, from ₱7,008.74 million in 2019 to ₱6,386.22 million in 2020 due to lower revenues from mall and other commercial centers which declined by 55% as a result of their closure and limited operations during quarantine period imposed to control the spread of COVID-19 pandemic. This is partially offset by 8% increase in office leasing revenue which continued to be 100% operational during the quarantine period. PDF Page 36.
7 DoubleDragon – REVENUES
Consolidated revenues decreased by ₱5.94 billion, or -29.4%, to ₱14.26 billion for the year ended December 31, 2020 compared to ₱20.20 billion for the year ended December 31, 2019.
The decrease in total revenues is due to higher unrealized gains from changes in fair values of investment property for 2019 compared to 2020.
The Company’s hotel revenues also decreased by ₱180.19 million or -26.8% to ₱491.87 million for the year ended December 31, 2020, compared to ₱672.06 million for the year ended December 31, 2019, however, gross margin of hotel operations actually improved to 38.1% in 2020 from 32.6% in 2019.
The Company’s real estate sales decreased by ₱1.10 billion, or -66.4%, to ₱557.36 million for the year ended December 31, 2020 compared to ₱1.66 billion for the year ended December 31, 2019 due to lower sales booked based on percentage of completion which was affected by restricted construction activities during the community quarantine period.
8 Century Properties – The pandemic has slowed down the sales take-up, collections and construction activities due to quarantine restrictions imposed by the government, resulting to a 25% decline in total real estate sales revenue. However, as affordable housing projects are located outside Metro Manila, the Company was able to resume construction as soon as the restrictions from provincial cities were lifted. The initial recognition of real estate sales revenues from newly launched projects of affordable housing projects in 2020 offsets such decline.
While mall operations declined, the impact on the leasing portfolio is not significant as its contribution is marginal to the total revenue of the Company prior to the COVID-19 pandemic. The increase in leasing revenue is a result of the initial rentals from the recently completed Century Diamond Tower.
25.25% decrease in real estate revenue
Real estate revenue has decreased as a result of the slowdown both in sales conversion and on construction and development activities due to prevailing community quarantine restrictions.
11.45% increase in leasing revenue
The increase was mainly due to the start of lease revenue recognition for initial leased out floor spaces of Century Diamond Tower and Asian Century Center. PDF Page 48.
5.44% decrease in property management fee and other services
The decrease was mainly due to reduced services rendered for the period due to streamlined building and property operations while NCR is in community quarantine.
66.60% decrease in interest income from real estate sales
Interest income from real estate sales represents interest accretion from installment contract receivables (ICR) and contract asset recognized during the year. Discount subject to accretion arises from the difference between present value of ICR and contract asset and its nominal value. Income decreased since majority of the projects are already turned over, and due to the slowdown in new sales during the nine-month period in 2020. PDF Page 49.
9 Rockwell Land – Rockwell Land Corporation’s consolidated net income after tax (NIAT) in 2020 amounted to P1.3 billion, a drop of 58% from last year’s P3.0 billion . As a percentage to revenues, net income was 12% for 2020, 19% for 2019 and 16% for 2018.
Total revenues dropped to P10.7 billion in 2020, 32% lower than 2019 revenues of P15.7 billion. Residential development accounted for 82% of the total revenues in 2020 and in 2019, lower than 86% in 2018 due to a higher contribution from commercial revenues. The contribution of Hotel Operations is at 1%, lower than last year’s 2%. PDF Page 28.
Residential Development contributed 82% of the total revenues of 2020. Total revenues reported from the sale of condominium units, including accretion of interest income, amounted to P8.8 billion. The 32% decrease in this segment’s revenue was mainly due to lower project accomplishment and sales bookings from the impact of the pandemic and the quarantine imposed starting March 16, 2020. EBITDA from this segment amounted to P2.2 billion, which represents 58% of the total EBITDA of P3.8 billion. PDF Page 30.
Reservation sales reached P7.8 billion, including asset sales, 53% lower than last year’s P16.7 billion, due to the quarantine restrictions and\ deferred launches of new projects.
Commercial Development revenues amounted to P1.8 billion, lower by 26% than last year. Leasing Income, which accounts for bulk of the segment revenues, dropped from P1.8 billion to P1.2 billion due mainly to the concessions given to the establishments across all Retail properties.
Hotel Operations contributed 1% of the total consolidated revenues for 2020. Revenues decreased from P289.9 to P76.8 million. Hotel Operations’ registered a P33 million loss from operations, from EBITDA of P76.8 million in 2019 due to the effect of COVID 19 in the sector. Costs and expenses under hotel operations include shelter in place expenses incurred by the company for its employees. PDF Page 31.


